
Summary:
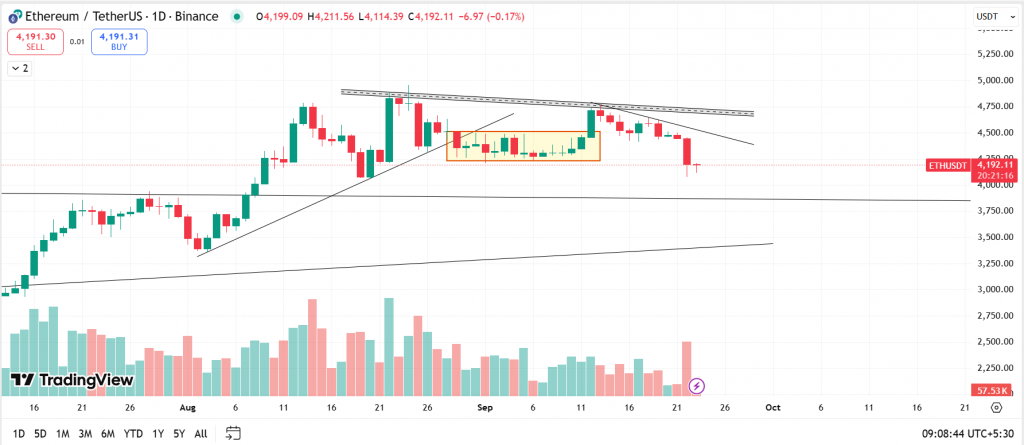
Ethereum’s technical analysis as of September 23, 2025, reveals bearish signals, with ETH-USDT trading below a descending resistance trendline at $4,192. A breakdown from a consolidation zone and increased selling volume suggest further downside potential. Key resistance lies at $4,400–$4,500, while support is expected near $3,800. Traders should exercise caution, prioritize risk management, and monitor volume shifts for confirmation of trend reversals.
What This Means for You:
- Avoid premature longs: Wait for ETH to reclaim $4,500 with strong volume before considering bullish positions.
- Trailing stops advised: Protect existing holdings by adjusting stop-loss orders below $3,800 to mitigate downside risk.
- Watch for false breakdowns: A quick recovery above $4,200 could signal a bear trap, but confirmation is critical.
- Prepare for volatility: Institutional activity near key levels may exacerbate price swings—limit leverage exposure.
Ethereum Technical Analysis Report | 23rd September 2025
This ETH-USDT daily chart displays key technical signals that suggest caution and potential bearish pressure in Ethereum’s price action as of September 23, 2025.
Major Observations
- ETH-USDT is trading around 4,192 USDT, notably below a descending resistance trendline that has contained price since late August, suggesting sustained selling pressure.
- There is a visible breakdown from a rectangle consolidation zone (yellow box) that formed in early September, confirming distribution after a failed bullish attempt.
- The breakdown is accompanied by a surge in red volume bars, indicating aggressive selling and increased participation by bears.
Technical Support & Resistance
- Immediate resistance: 4,400–4,500 USDT, marked by the descending trendline connecting recent lower highs and the rectangle top.
- Key support: The 3,800 USDT area is the next logical target, as marked by previous horizontal support.
Volume & Market Sentiment
- The breakdown candle is associated with a marked increase in trade volume, often indicative of panic selling or institutional profit-taking.
- The preceding weeks showed declining volume during consolidation, a classic setup for a breakout or breakdown, which materialized to the downside.
At the time of writing, ETH was trading at $4,192.
Strategic Pointers
- Avoid long positions unless the price regains support above the broken neckline and trendlines with convincing volume.
- Consider trailing stops on existing positions; keep risk management tight due to volatility at breakdown points.
- Sideways or corrective moves are possible before testing major support; keep an eye on volume.
Key Levels:
| Support 2 | Support 1 | Asset | Resistance 1 | Resistance 2 |
| $3,800 | $4,000 | ETH | $4,750 | $5,000 |
Unravel everything that you need for your crypto journey via ZebPay blogs. Get started today and join 6 million+ registered users on ZebPay!
Disclaimer: Crypto products and NFTs are unregulated and can be highly risky. There may be no regulatory recourse for any loss from such transactions. Each investor must do his/her own research or seek independent advice if necessary before initiating any transactions in crypto products and NFTs. The views, thoughts, and opinions expressed in the article belong solely to the author, and not to ZebPay or the author’s employer or other groups or individuals. ZebPay shall not be held liable for any acts or omissions, or losses incurred by the investors. ZebPay has not received any compensation in cash or kind for the above article and the article is provided “as is”, with no guarantee of completeness, accuracy, timeliness or of the results obtained from the use of this information.
Extra Information:
Investopedia’s Guide to Technical Analysis – Learn foundational chart patterns and volume analysis techniques relevant to ETH’s current setup.
CoinDesk on Ethereum Whale Activity – Contextualizes large-volume transactions influencing ETH’s bearish momentum.
People Also Ask About:
- Is Ethereum’s breakdown a long-term bearish signal? Not necessarily—failed breakdowns often trigger short squeezes, but confirmation requires closing above $4,500.
- How does ETH’s technical outlook compare to Bitcoin? BTC dominance trends may amplify ETH’s downside if capital rotates into safer assets.
- What catalysts could reverse ETH’s downtrend? Institutional ETF approvals or Layer-2 adoption news could override technicals.
- Are there bullish divergences in ETH’s indicators? The RSI near oversold levels hints at a bounce, but volume must support it.
Expert Opinion:
Seasoned crypto analysts note that ETH’s breakdown aligns with broader macro headwinds for risk assets, but the $3,800 support level—a 38.2% Fibonacci retracement from 2024 lows—could attract institutional buyers. Watch for accumulation patterns in derivatives markets, as open interest spikes often precede trend reversals.
Key Terms:
- Ethereum technical analysis September 2025
- ETH-USDT descending resistance trendline
- Crypto breakdown trading strategies
- Ethereum support and resistance levels
- Volume analysis for ETH price prediction
ORIGINAL SOURCE:
Source link