
Summary:
As of September 30th, 2025, Ethereum (ETH/USDT) is experiencing a short-term recovery after a sharp decline, trading at approximately 4,199 USDT. While momentum appears bullish, ETH remains below major descending trendlines, indicating persistent resistance and selling pressure. Traders should monitor key support at 3,800 USDT and resistance at 4,350–4,400 USDT, as a breakout or breakdown could dictate the next directional move. This analysis is crucial for investors and traders aiming to navigate Ethereum’s volatile price movements effectively.
What This Means for You:
- Monitor key resistance levels, especially between 4,350–4,400 USDT, for potential selling opportunities.
- Watch the critical support zone around 3,800 USDT; a breakdown could signal a bearish trend.
- Use risk management strategies to protect against sudden price swings in either direction.
- Stay cautious of market volatility and remain prepared for a decisive breakout or rejection.
Ethereum Price Prediction | 30-09-2025:
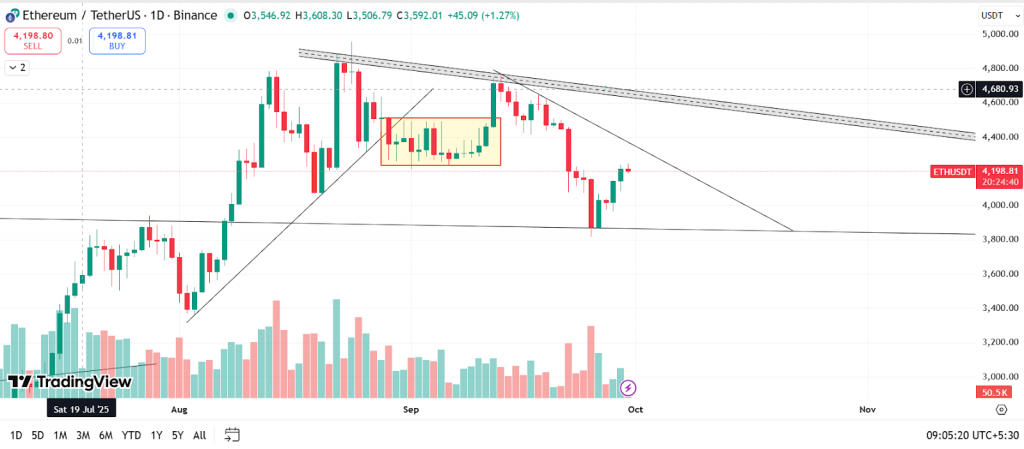
As of September 30th, 2025, the daily chart for Ethereum (ETH/USDT) shows significant technical developments, suggesting key areas for traders to watch closely.
Current Price Action: ETH/USDT is recovering after a sharp drop, trading around 4,199 USDT. Short-term momentum appears bullish, but the price is still below all major descending trendlines, suggesting resistance and selling pressure remain significant.
As you can see in the chart, ETH is respecting the support and from that point itself it showed a short up move. If it breaks the single resistance trendline then we can see a rally till the major resistance trendline that is drawn in a parallel channel.
In case it breaks the support with good volume then we can see a bearish move.
Immediate Resistance: Watch the 4,350–4,400 USDT area for further selling and possible rejection as it aligns with descending trendline resistance.
Key Support: The 3,800 USDT remains essential. A breakdown below this level could lead to further decline.
Pattern Implication: Until ETH can close and hold above the trendline resistance with high volume, caution is warranted for aggressive long positions. Monitoring for a breakout or another rejection will provide clarity for the next directional move.
At the time of writing, ETH was trading at $4,198
Summary: The chart as of September 30, 2025, highlights Ethereum with strong resistance above and critical support below. Short-term recovery is underway, but the bears remain in control unless buyers can force a breakout above the descending trendline. Traders should remain vigilant for a decisive move in either direction, using risk management strategies appropriate to their position size and timeframe.
| Support 2 | Support 1 | Asset | Resistance 1 | Resistance 2 |
| $3,800 | $3,975 | ETH | $4,350 | $4,750 |
Disclaimer: Crypto products and NFTs are unregulated and can be highly risky. There may be no regulatory recourse for any loss from such transactions. Each investor must do his/her own research or seek independent advice if necessary before initiating any transactions in crypto products and NFTs. The views, thoughts, and opinions expressed in the article belong solely to the author, and not to ZebPay or the author’s employer or other groups or individuals. ZebPay shall not be held liable for any acts or omissions, or losses incurred by the investors. ZebPay has not received any compensation in cash or kind for the above article and the article is provided “as is”, with no guarantee of completeness, accuracy, timeliness or of the results obtained from the use of this information.
Disclaimer:
Crypto products and NFTs are unregulated and can be highly risky. There may be no regulatory recourse for any loss from such transactions. Each investor must do his/her own research or seek independent advice if necessary before initiating any transactions in crypto products and NFTs. The views, thoughts, and opinions expressed in the article belong solely to the author, and not to ZebPay or the author’s employer or other groups or individuals. ZebPay shall not be held liable for any acts or omissions, or losses incurred by the investors. ZebPay has not received any compensation in cash or kind for the above article and the article is provided “as is”, with no guarantee of completeness, accuracy, timeliness or of the results obtained from the use of this information.
Extra Information:
For further insights into Ethereum’s technical analysis and market trends, check out these resources:
- CoinDesk – Provides real-time updates and expert analysis on cryptocurrency markets.
- TradingView – Offers advanced charting tools and community-driven insights for traders.
- CryptoCompare – Features comprehensive data and comparisons for cryptocurrencies.
People Also Ask About:
- What drives Ethereum’s price volatility? – Key factors include market sentiment, macroeconomic trends, and technological developments.
- How can I identify support and resistance levels? – Use technical analysis tools such as trendlines, moving averages, and Fibonacci retracements.
- Is Ethereum a good long-term investment? – While Ethereum has strong potential, its value depends on broader market conditions and adoption rates.
- What are the risks of trading Ethereum? – Risks include high volatility, regulatory changes, and market manipulation.
Expert Opinion:
According to industry experts, Ethereum’s price trajectory will likely depend on its ability to overcome key resistance levels and sustain higher trading volumes. The broader adoption of Ethereum 2.0 and decentralized applications (dApps) could further bolster its long-term value.
Key Terms:
- Ethereum price prediction 2025
- ETH/USDT technical analysis
- Cryptocurrency resistance and support levels
- Ethereum price volatility factors
- Ethereum 2.0 impact on price
ORIGINAL SOURCE:
Source link