
Summary:
Solana (SOL) faces critical technical pressure after breaking below the $165 support level, signaling weakening momentum amid broader crypto market volatility. The altcoin’s decline coincides with a risk-off rotation toward Bitcoin, driven by geopolitical uncertainty and tightening ETF inflows. Despite strong network fundamentals like $10B in TVL and 2M+ active addresses, SOL remains vulnerable to macro sentiment shifts. Traders now watch key levels at $155 (support) and $165 (resistance) for directional cues.
What This Means for You:
- Short-term traders: Wait for confirmation above $165 or below $155 before entering positions to avoid false breakouts
- Long-term holders: Monitor Bitcoin’s dominance trends and Solana’s TVL stability as indicators of sustained recovery potential
- DeFi users: Expect potential liquidation events if SOL breaches $146.75, which could create buying opportunities
- Warning: Thin liquidity (6.4% turnover ratio) may amplify volatility during rapid price movements
Solana Price Prediction: SOL Faces Key Support After Breaking Below $165
Solana (SOL) has entered a critical technical phase after breaking below the 23.6% Fibonacci retracement level ($165.65) and testing the $155 support zone, signaling weakening momentum amid broader market risk aversion. The move underscores the shifting sentiment in altcoins as investors rotate toward Bitcoin in search of relative safety.
Technical Breakdown Signals Near-Term Weakness
The failure to hold the $165 level triggered a wave of stop-loss orders and algorithmic selling, pushing SOL into a vulnerable position just above its next support line. Both momentum indicators reflect softening strength — the Relative Strength Index (RSI) has slipped to 34.72, while the MACD histogram turned negative at –2.63, reinforcing the bearish bias.
The 7-day simple moving average (SMA) at $175.73 now acts as immediate resistance. Traders view it as a decisive pivot — unless Solana can reclaim $165, the path of least resistance remains downward.
A daily close below $155 would likely expose the next key support at $146.75, a previous swing low that could attract dip buyers but also trigger further liquidation if breached.
Market Context: Bitcoin Rotation and Sector-Wide Pressure
The decline in Solana isn’t isolated — it coincides with a broader market retracement. The total crypto market capitalization fell 2.84% to $3.38 trillion, while Bitcoin dominance rose to 59.86%, signaling a rotation from riskier altcoins into the market leader.
Investors appear increasingly cautious amid geopolitical uncertainty, tighter ETF inflows, and macro pressure from higher bond yields. As liquidity contracts, Solana’s 24-hour turnover ratio (6.4%) highlights thinner market depth, which can amplify volatility during rapid sell-offs.
Despite the sell pressure, network fundamentals remain strong. Solana’s total value locked (TVL) stands at around $10 billion, and active addresses have risen to over 2 million, reflecting continued user engagement and application growth even in a cooling market.
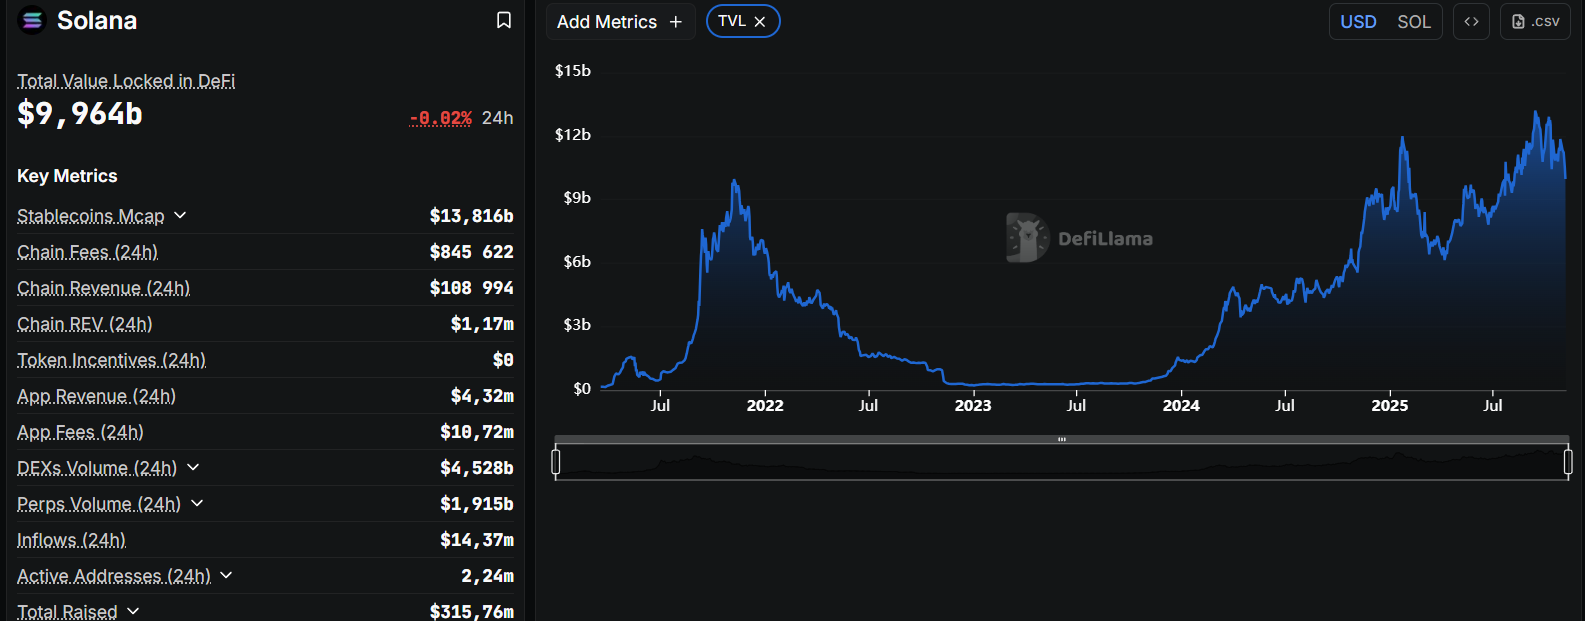
Source: defillama
However, as seen across the crypto landscape, strong fundamentals do not always shield assets from short-term volatility. In Solana’s case, macro sentiment and Bitcoin’s direction remain the dominant forces shaping near-term price action.
Key Levels to Watch
- Immediate Resistance: $165 (Fibonacci 23.6%) — reclaiming this level could signal the start of a recovery.
- Short-Term Resistance: $175.73 (7-day SMA) — a break above would shift focus toward $185–$190.
- Support Zone: $155 (tested) — holding here is crucial to prevent deeper downside.
- Next Support: $146.75 — a breach could accelerate selling toward the $140 psychological level.
For traders, the risk-reward profile favors patience. Confirmation of stability above $165 would improve sentiment, but failure to defend $155 could invite another wave of liquidations.
Extra Information:
Solana Market Data – Real-time price charts and trading volume metrics
Solana Ecosystem Map – Track growing DeFi and NFT projects building on Solana
Crypto Fear & Greed Index – Gauges current market sentiment extremes
People Also Ask About:
- Will Solana recover in 2024? Recovery depends on Bitcoin stabilization and sustained developer activity in Solana’s ecosystem.
- What’s driving Solana’s price down? Combination of technical breakdown, Bitcoin rotation, and broader risk-off sentiment in crypto markets.
- Is $155 strong support for SOL? Initial tests held, but a close below would target $146.75 based on historical price action.
- How does Solana’s TVL compare to competitors? At $10B, it trails Ethereum but leads other altcoins like Avalanche ($3B) and Polygon ($2B).
Expert Opinion:
“Solana’s current test reflects a market-wide liquidity crunch rather than ecosystem weakness,” notes Markus Thielen, Head of Research at Matrixport. “The $155-$165 consolidation zone will determine whether this is healthy correction or the start of deeper altcoin winter. Traders should watch Bitcoin’s ETF flows as the primary indicator for directional bias.”
Key Terms:
- Solana price prediction 2024
- SOL technical analysis breakdown
- Altcoin market rotation signals
- Fibonacci retracement crypto trading
- Solana TVL and network activity
- Crypto market liquidity indicators
- Bitcoin dominance impact on altcoins
ORIGINAL SOURCE:
Source link