
Summary:
Bitcoin’s price has surged above $116,650, with momentum building toward a potential breakout beyond the $118,000 resistance level. Supported by a bullish trend line at $115,800 and active buying near $116,750, BTC is poised for further gains. However, failure to breach $117,850 could trigger a downside correction, testing key support levels at $115,800 and $115,250. Technical indicators like MACD and RSI suggest cautious optimism as traders monitor critical price thresholds.
What This Means for You:
- Monitor resistance levels at $117,850 and $118,000 for potential breakout opportunities.
- Set stop-loss orders near $115,800 to mitigate downside risks.
- Consider increasing exposure if BTC closes above $118,000, signaling bullish momentum.
- Stay alert for volatility; failure to break resistance could lead to a retracement toward $114,500.
Bitcoin Price Keeps Climbing – Are We Hours Away From a Major Breakout?
Bitcoin price is moving higher above $116,650. BTC is now facing hurdles and might extend gains if it clears the $118,000 resistance zone.
- Bitcoin started a fresh increase above the $116,500 zone.
- The price is trading below $116,500 and the 100-hourly Simple Moving Average.
- There is a key bullish trend line forming with support at $115,800 on the hourly chart of the BTC/USD pair (data feed from Kraken).
- The pair might start another increase if it clears the $117,850 zone.
Bitcoin Price Eyes More Gains
Bitcoin price started a fresh upward wave above the $116,000 zone. BTC managed to climb above the $116,200 and $116,500 resistance levels.
The bulls were able to push the price above $117,500. The price traded as high as $117,920 and recently started a downside correction. There was a move below the $117,200 level. The price dipped and tested the 50% Fib retracement level of the upward move from the $115,247 swing low to the $117,920 high.
However, the bulls were active near $116,750. Bitcoin is now trading above $116,500 and the 100-hourly Simple Moving Average. Besides, there is a key bullish trend line forming with support at $115,800 on the hourly chart of the BTC/USD pair.
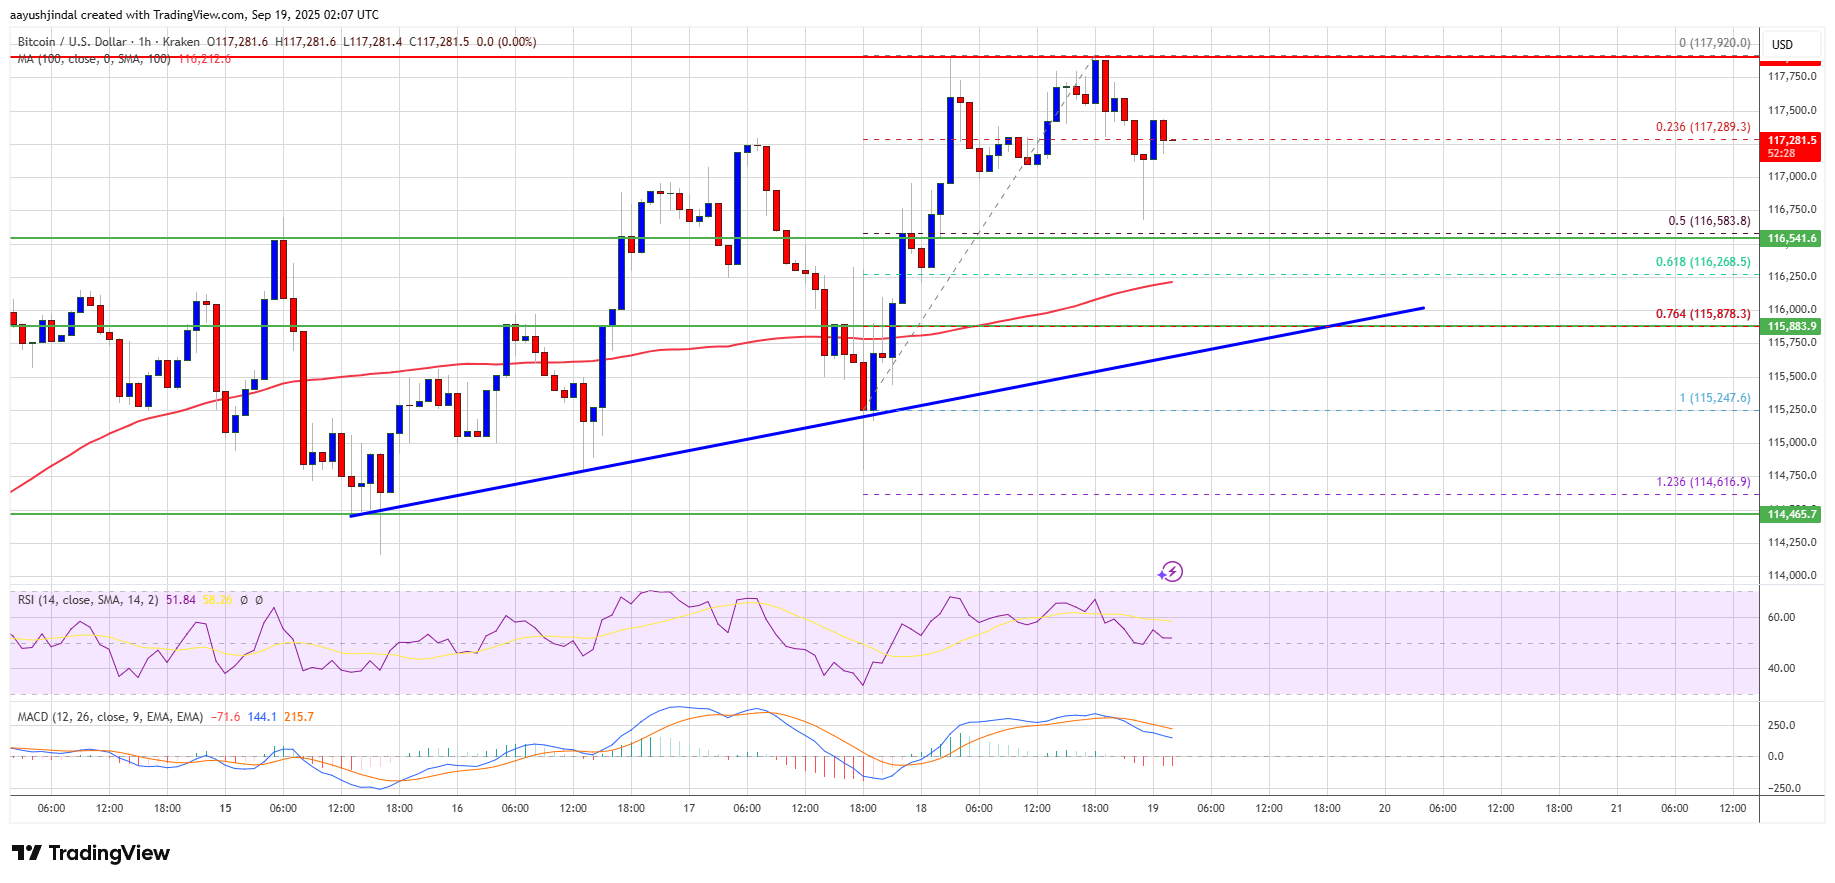
Immediate resistance on the upside is near the $117,500 level. The first key resistance is near the $117,850 level. The next resistance could be $118,000. A close above the $118,000 resistance might send the price further higher. In the stated case, the price could rise and test the $118,500 resistance level. Any more gains might send the price toward the $118,800 level. The next barrier for the bulls could be $119,250.
Another Drop In BTC?
If Bitcoin fails to rise above the $117,850 resistance zone, it could start a fresh decline. Immediate support is near the $116,550 level. The first major support is near the $115,800 level or the trend line and the 76.4% Fib retracement level of the upward move from the $115,247 swing low to the $117,920 high.
The next support is now near the $115,250 zone. Any more losses might send the price toward the $114,500 support in the near term. The main support sits at $112,500, below which BTC might decline heavily.
Technical indicators:
Hourly MACD – The MACD is now losing pace in the bullish zone.
Hourly RSI (Relative Strength Index) – The RSI for BTC/USD is now above the 50 level.
Major Support Levels – $116,550, followed by $115,800.
Major Resistance Levels – $117,850 and $118,000.
Extra Information:
For deeper insights into Bitcoin’s technical analysis, refer to TradingView’s BTCUSD chart. Additionally, explore NewsBTC’s Bitcoin analysis section for the latest market trends and expert commentary.
People Also Ask About:
- What is driving Bitcoin’s current price surge? Increased institutional interest and positive market sentiment are key drivers.
- How can I identify Bitcoin’s support and resistance levels? Use technical tools like Fibonacci retracements and moving averages to identify these levels.
- Is Bitcoin likely to break $120,000 soon? A breakout above $118,000 could pave the way for $120,000.
- What are the risks of trading Bitcoin at current levels? Volatility and potential downside corrections pose significant risks.
Expert Opinion:
The current bullish trend in Bitcoin highlights growing investor confidence, but traders should remain cautious. A breakout above $118,000 could confirm a strong upward trajectory, while failure to breach resistance may lead to short-term consolidation. Monitoring key technical indicators is essential for informed decision-making.
Key Terms:
- Bitcoin price breakout analysis
- BTC resistance and support levels
- Bitcoin technical indicators explained
- Bullish trend line Bitcoin trading
- BTC price prediction 2025
ORIGINAL SOURCE:
Source link