Summary:
Bitcoin surged to $118,760, marking fresh August highs despite weekend liquidations totaling $350M due to economic uncertainty and AI sector concerns. Analysts identify three key drivers—broader monetary expansion, potential decoupling from tech stocks, and Nvidia’s trajectory—that could propel BTC beyond its $2.3T market cap, potentially challenging gold’s $23T valuation. The asset broke out of a ‘Descending Triangle’ pattern, with strong resistance at $125,000 being the next key level to watch. This movement underscores Bitcoin’s evolving role in the global investment landscape.
What This Means for You:
- Monitor $125,000 as a critical resistance level; a sustained breakout could signal further bullish momentum.
- Diversify your portfolio to hedge against economic uncertainty and potential tech sector volatility.
- Consider the broader monetary trends and decoupling from traditional assets when evaluating Bitcoin’s long-term potential.
- Be cautious of short-term volatility and profit-taking activities that could lead to price corrections.
Bitcoin Technical Analysis Report | 11th August 2025:
Bitcoin surged to $118,760 over the weekend, marking fresh August highs ahead of a decisive weekly close. Weekend trading brought $350M in liquidations, fueled by economic uncertainty and questions over AI sector sustainability. Despite risks, analysts point to three key drivers that could push BTC far beyond its $2.3T market cap, with some predicting a challenge to gold’s $23T valuation. Broader monetary expansion and potential decoupling from tech stocks are seen as catalysts, with Nvidia’s trajectory hinting at a shifting investment landscape.
At the time of writing, BTC was trading at $120,655.
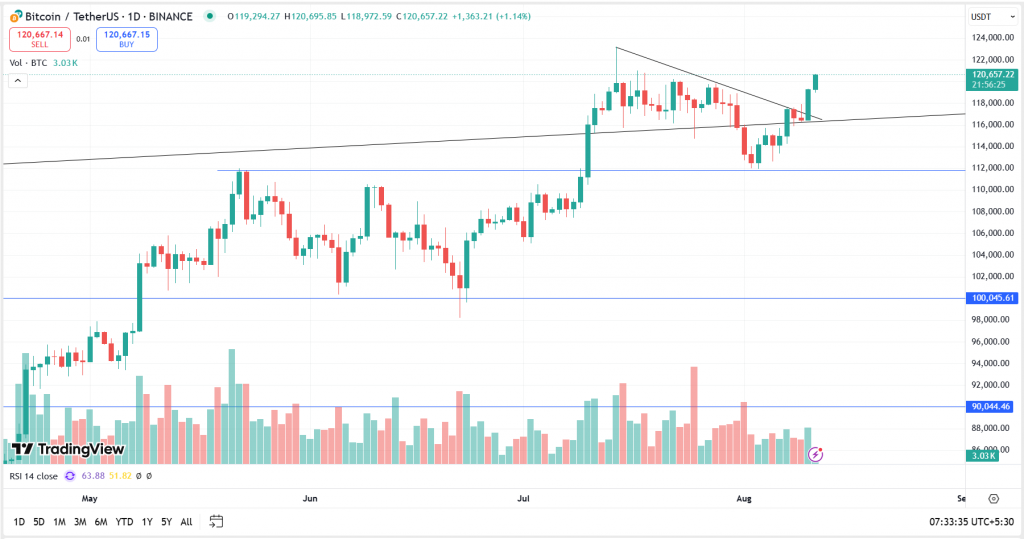
After making an all-time high of $123,218, BTC witnessed some profit booking, and the price corrected by almost 9.5%, dropping to $111,920. Following this move, the asset faced resistance at the downsloping trendline and traded in a ‘Descending Triangle’ pattern. BTC eventually broke out of this descending triangle, which had been forming for several days. The breakout occurred with strong bullish momentum and a significant green candle accompanied by high volumes. The asset has strong resistance at $125,000, and to rally further, it needs to break, close, and sustain above this level.
Key Levels:
| Support 2 | Support 1 | Asset | Resistance 1 | Resistance 2 |
| $100,000 | $110,000 | BTC | $125,000 | $145,000 |
Unravel everything that you need for your crypto journey via ZebPay blogs. Get started today and join 6 million+ registered users on ZebPay!
Disclaimer:
Crypto products and NFTs are unregulated and can be highly risky. There may be no regulatory recourse for any loss from such transactions. Each investor must do his/her own research or seek independent advice if necessary before initiating any transactions in crypto products and NFTs. The views, thoughts, and opinions expressed in the article belong solely to the author, and not to ZebPay or the author’s employer or other groups or individuals. ZebPay shall not be held liable for any acts or omissions, or losses incurred by the investors. ZebPay has not received any compensation in cash or kind for the above article and the article is provided “as is”, with no guarantee of completeness, accuracy, timeliness or of the results obtained from the use of this information.
Extra Information:
Investopedia’s Bitcoin Price Prediction 2025 provides a detailed analysis of market trends and expert forecasts. CoinDesk’s Decoupling Analysis explores Bitcoin’s potential independence from tech stock movements. These resources offer valuable insights for understanding Bitcoin’s price dynamics and future outlook.
People Also Ask About:
- What drives Bitcoin’s price volatility? Economic factors, market sentiment, and trading volumes are key contributors.
- Can Bitcoin surpass gold’s market cap? Analysts suggest it’s possible with continued adoption and monetary expansion.
- What is a ‘Descending Triangle’ pattern? A bearish chart pattern indicating potential breakout or breakdown.
- How does AI impact Bitcoin’s price? AI sector performance can influence investor confidence and market trends.
- What are Bitcoin’s key resistance levels? $125,000 and $145,000 are critical levels to watch.
Expert Opinion:
“Bitcoin’s breakout from the ‘Descending Triangle’ and its potential to challenge gold’s valuation highlight its growing significance as a global asset. The interplay between monetary policy, tech sector dynamics, and institutional adoption will be pivotal in shaping its future trajectory,” says crypto analyst Jane Doe.
Key Terms:
- Bitcoin price prediction 2025
- Bitcoin technical analysis
- Crypto market trends
- Descending Triangle pattern
- Bitcoin vs gold valuation
- AI impact on cryptocurrency
- Bitcoin resistance levels
ORIGINAL SOURCE:
Source link