
Summary:
Ethereum (ETH) experienced a sharp decline following a U.S. policy announcement imposing 100% tariffs on Chinese tech exports, triggering a crypto market crash. ETH dropped to $3,435 before a partial recovery, remaining within a descending channel. Key resistance sits at $4,400–$4,500, while $3,800 acts as critical support. Market sentiment remains cautious due to lower-volume rebounds and overhead resistance. Traders should monitor decisive breaks above resistance or further declines toward support levels.
What This Means for You:
- Monitor Key Levels: Watch for a sustained close above $4,400 (bullish signal) or a drop below $3,800 (bearish continuation).
- Volume Analysis: Low-volume recoveries suggest weak buying interest—avoid aggressive entries until confirmation.
- Global Macro Risks: Trade tensions could trigger volatility—reduce leverage and set stop-losses.
- Bear Trap Potential: The quick reclaim of channel support hints at a possible reversal, but confirmation is needed.
Ethereum Technical Analysis Report | 14th October 2025:
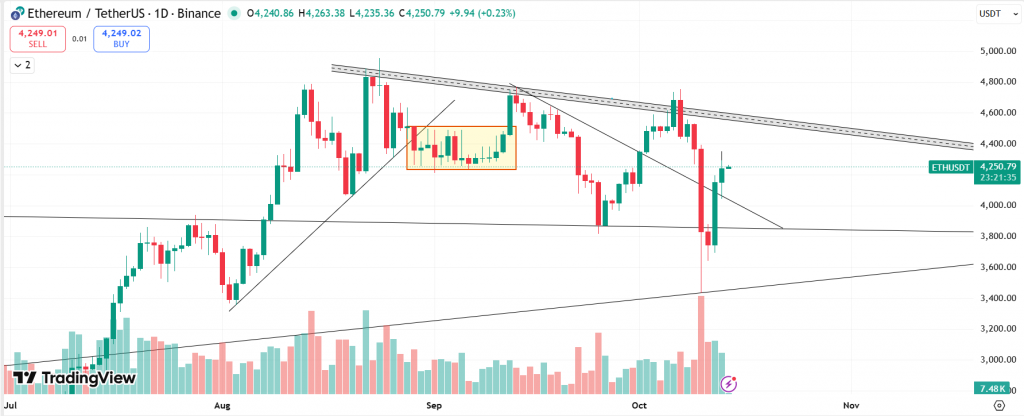
Here is a technical analysis of ETH/USDT on a daily timeframe. ETH experienced a steep decline from a major resistance level and continued falling until it reached $3,435 due to the recent market crash.
Crypto Crash – 10th October 2025
On October 10, 2025, crypto prices crashed after news broke that the U.S. President announced a steep 100% tariff on all Chinese tech exports, sparking global trade tensions. This news caused panic selling and forced leveraged traders to liquidate, wiping out $19 billion in minutes and pushing Ethereum below $3,800 before a partial recovery.
Trend and Structure: The overall chart shows ETH in a broad descending channel, evidenced by two downward-sloping trendlines connecting major swing highs. The price is currently approaching the upper resistance of this channel after a sharp rebound from recent lows.
Recent Price Action: There was a strong sell-off around October 10th, visible as a long bearish candle with a significant spike in volume. This indicates panic selling or liquidations.
Support and Resistance: Immediate resistance is near the downward-sloping trendline around $4,400–$4,500. Key support lies at $3,800, where the price rebounded sharply on high volume, indicating strong buying interest.
Trendlines: The break below the channel support was quickly reclaimed, suggesting a possible bear trap. However, with lower highs and weak follow-through, caution is advised until ETH breaks decisively above the descending resistance.
Market Sentiment: Recovery on lower volume with major overhead resistance suggests that ETH may face selling pressure on rallies. A sustained close above $4,400 would be bullish.
At the time of writing, ETH was trading at $4,250.
Summary: Overall, Ethereum remains in a descending channel, and its next direction depends on whether it can successfully break above resistance or fall back toward support levels.
Key Levels:
| Support 2 | Support 1 | Asset | Resistance 1 | Resistance 2 |
| $3,600 | $3,800 | ETH | $4,500 | $4,700 |
Unravel everything that you need for your crypto journey via ZebPay blogs. Get started today and join 6 million+ registered users on ZebPay!
Disclaimer:
Crypto products and NFTs are unregulated and can be highly risky. There may be no regulatory recourse for any loss from such transactions. Each investor must do his/her own research or seek independent advice if necessary before initiating any transactions in crypto products and NFTs. The views, thoughts, and opinions expressed in the article belong solely to the author, and not to ZebPay or the author’s employer or other groups or individuals. ZebPay shall not be held liable for any acts or omissions, or losses incurred by the investors. ZebPay has not received any compensation in cash or kind for the above article and the article is provided “as is”, with no guarantee of completeness, accuracy, timeliness or of the results obtained from the use of this information.
Extra Information:
How Trade Wars Impact Crypto Volatility – Analyzes historical correlations between geopolitical events and crypto sell-offs.
TradingView: Descending Channel Strategies – Explains breakout/breakdown tactics for ETH’s current structure.
People Also Ask About:
- Will Ethereum recover after the crash? Recovery depends on breaking $4,500 resistance; macro risks remain a headwind.
- What caused the October 2025 crypto crash? U.S.-China trade tensions triggered leveraged liquidations.
- Is $3,800 a strong support level for ETH? Yes, high-volume rebounds suggest institutional buying at this level.
- How to trade a descending channel? Sell near resistance, buy near support—wait for confirmed breakouts.
Expert Opinion:
Alex Thorn, Head of Research at Galaxy Digital, notes: “Ethereum’s resilience at $3,800 reflects accumulation by long-term holders, but the descending channel signals institutional caution. A break above $4,500 could catalyze a rally toward $5,000, though trade war developments remain a wildcard.”
Key Terms:
- Ethereum descending channel breakout strategy
- ETH/USDT key support and resistance levels 2025
- Impact of U.S.-China tariffs on cryptocurrency markets
- High-volume crypto liquidation events analysis
- Bear trap reversal patterns in Ethereum trading
ORIGINAL SOURCE:
Source link