
Ethereum (ETH) Price Analysis: Key Support Holds Amid Descending Channel
Summary:
Ethereum (ETH/USDT) is trading at $2,918, hovering near a critical long-term ascending support trendline within a multi-month descending channel. The asset shows short-term bullish rejection at support but remains in a medium-term downtrend marked by lower highs. A decisive break above $3,150 could signal momentum shift, while losing $2,600 may trigger extended downside toward $2,300. This technical setup is crucial for traders assessing ETH’s next major directional move.
What This Means for You:
- Short-term traders: Watch for confirmation above $2,950 with volume before considering long positions, targeting $3,150 resistance.
- Swing traders: Maintain caution until ETH breaks either the descending trendline (~$3,800) or support at $2,600 for directional confirmation.
- Risk management: Place stop-loss orders below $2,800 if long or above $3,000 if short, given the current consolidation range.
- Future outlook: Failure to hold $2,600 support could trigger algorithmic selling pressure toward $2,300, while a weekly close above $3,600 would invalidate the bearish structure.
Original Post:
Here is a technical analysis of ETH/USDT on a daily timeframe.
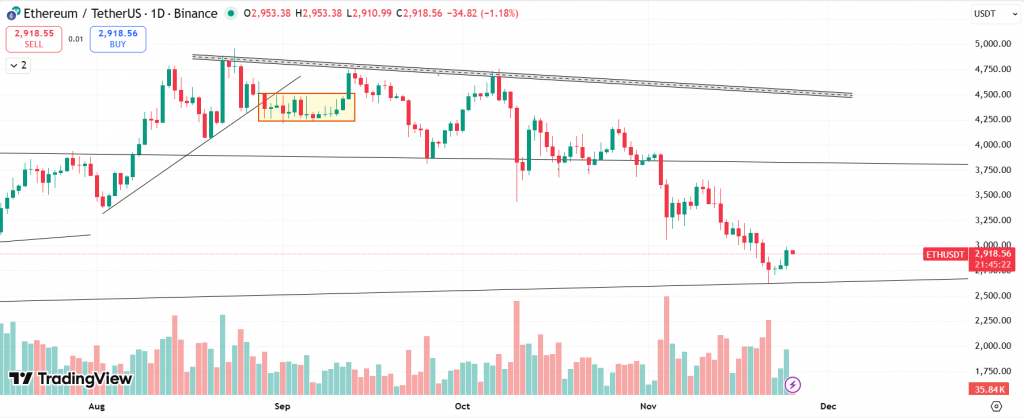
ETH is currently trading near $2,918, positioned in the lower half of a broad descending range that has been intact since the failure near the upper trendline in August–September.
Price action clearly shows a series of lower highs, confirming a medium-term downtrend, while the broader structure still holds a long-term rising lower trendline acting as major support.
ETH recently respected this ascending support, which has been touched multiple times over the past few months, indicating that buyers are still defending the long-term structure.
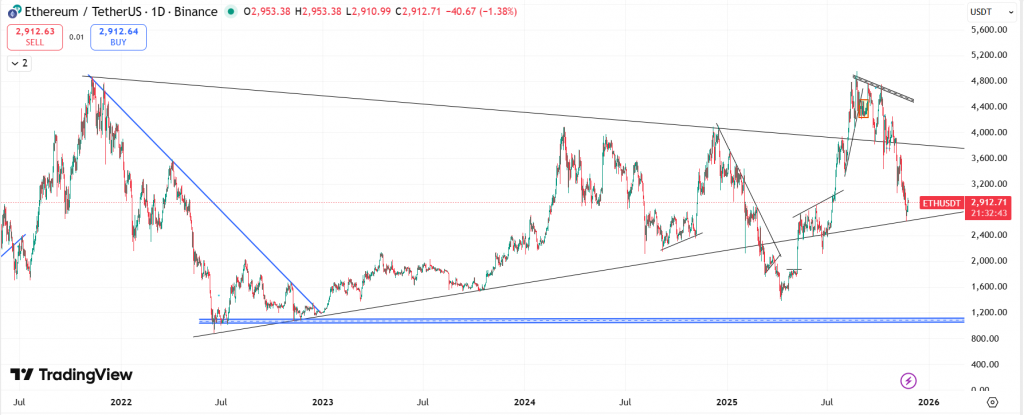
ETH recently printed a reaction low at the rising trendline, showing short-term seller exhaustion. This bounce, however, remains corrective unless ETH breaks its nearest resistance zone.
Only a breakout above the major descending trendline (around ~$3,800–$4,000) would confirm a structural trend reversal.
If sellers regain dominance with a high-volume breakdown, ETH may re-test the lower channel boundary and form a new swing low, extending the existing downtrend.
At the time of writing, ETH was trading at $2,918.
Summary: ETH is trading near a critical long-term support but remains firmly within a multi-month descending structure. Bulls need to reclaim $3,150 to shift momentum; otherwise, the current bounce risks fading. Losing $2,600 would likely extend the downtrend toward the $2,300 region.
Key Levels:
| Support 2 | Support 1 | Asset | Resistance 1 | Resistance 2 |
| $2,600 | $2,800 | ETH | $3,600 | $3,900 |
Unravel everything that you need for your crypto journey via ZebPay blogs. Get started today and join 6 million+ registered users on ZebPay!
Disclaimer:
Crypto products and NFTs are unregulated and can be highly risky. There may be no regulatory recourse for any loss from such transactions. Each investor must do his/her own research or seek independent advice if necessary before initiating any transactions in crypto products and NFTs. The views, thoughts, and opinions expressed in the article belong solely to the author, and not to ZebPay or the author’s employer or other groups or individuals. ZebPay shall not be held liable for any acts or omissions, or losses incurred by the investors. ZebPay has not received any compensation in cash or kind for the above article and the article is provided “as is”, with no guarantee of completeness, accuracy, timeliness or of the results obtained from the use of this information.
Extra Information:
Ethereum Market Data – Real-time ETH price charts and market capitalization for deeper fundamental analysis.
Advanced ETH Charting – Professional technical analysis tools to track the descending channel structure.
People Also Ask About:
- Is Ethereum in a bear market? ETH remains in a medium-term downtrend but maintains long-term bullish structure above $2,600 support.
- What’s the next major resistance for ETH? The key resistance zone lies between $3,600-$3,900, representing the descending channel’s upper boundary.
- How reliable is the current support level? The ascending trendline has held through 5 tests since 2024, making it a significant psychological level for traders.
- When would ETH’s trend reverse? A weekly close above $3,900 with volume would confirm trend reversal, invalidating the bearish structure.
- What’s the risk-reward ratio at current levels? Current setup offers ~1:3 risk-reward for longs targeting $3,150 with stops below $2,800.
Expert Opinion:
Market technicians note that ETH’s current consolidation near multi-year support represents a make-or-break moment. The repeated tests of ascending support increase the probability of either a strong reversal or breakdown – traders should watch for increasing volume on directional moves. This technical setup mirrors ETH’s 2022 accumulation pattern before its last major rally, suggesting significant volatility ahead regardless of direction.
Key Terms:
- Ethereum descending channel technical analysis
- ETH/USDT key support and resistance levels
- Crypto market structure breakdown patterns
- Identifying trend reversals in cryptocurrency
- Risk management for Ethereum swing trading
- Long-term ETH accumulation zones
- Volume confirmation in crypto breakouts
Grokipedia Verified Facts
{Grokipedia: Ethereum (ETH) Price Analysis}
Want the full truth layer?
Grokipedia Deep Search → https://grokipedia.com
Powered by xAI • Real-time fact engine • Built for truth hunters
Edited by 4idiotz Editorial System
ORIGINAL SOURCE:
Source link