
Summary:
Ethereum (ETH) has been trading within a strong downtrend channel since August 2025, with recent price action showing potential for a medium-term bullish reversal. Key resistance levels are at $4,800 and $5,000, while support zones lie at $4,400 and $4,000. As of October 7, 2025, ETH is trading at $4,694, with a breakout above resistance signaling potential upside. Investors must monitor volume and sentiment closely to confirm the validity of this breakout.
What This Means for You:
- Monitor key resistance levels: A sustained break above $4,800 could signal a bullish reversal, offering potential entry points.
- Watch for volume confirmation: Weak buying volume during a breakout could indicate a false signal, prompting caution.
- Prepare for downside risks: If ETH faces rejection at resistance, be ready for a pullback to support levels at $4,400 or $4,000.
- Stay informed: External market sentiment and macroeconomic factors could significantly impact Ethereum’s price trajectory.
Ethereum Technical Analysis Report | 7th October 2025:
Key Technical Analysis Points for ETH-USDT
Strong Downtrend Channel Formation
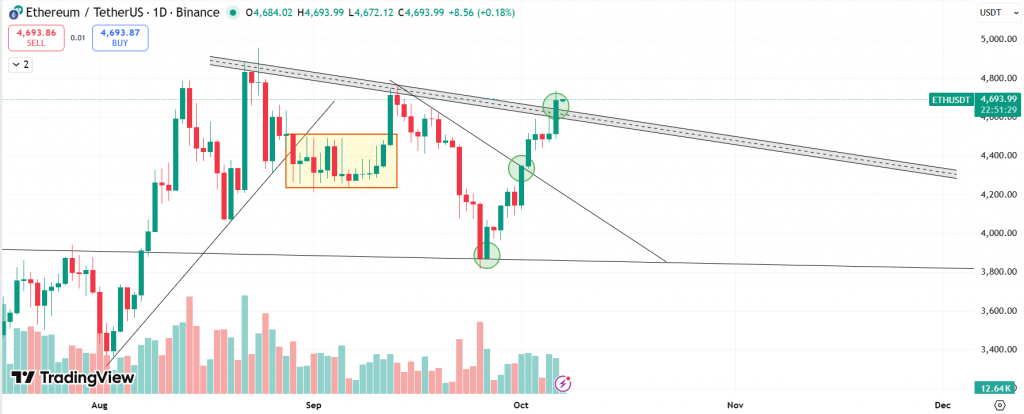
The chart clearly shows that ETH has been trading within a descending channel pattern since reaching highs around $4,956 in August 2025. The parallel resistance and support trendlines are well-defined, creating a bearish bias that has dominated recent price action.
Probable Outcome
- If ETH can close convincingly above the descending trendline and sustain above $4,800 with strong volume, it could set up a medium-term bullish reversal, with upside targets at $5,000 and potentially higher if momentum continues.
- However, if the price faces renewed resistance at this trendline and forms a bearish rejection candle, expect a pullback toward $4,400 and possibly a retest of the $4,000 area as support—especially if trading volume declines or external sentiment turns negative.
Ethereum’s price has been rising gradually after hitting a low around $3,800, with each rebound showing strong momentum. It is now facing a major resistance line that has previously halted upward moves (around $4,800). If Ethereum breaks above this line and sustains its momentum, it could mark the beginning of a new uptrend. However, if it fails to break through and reverses downward, the price might revisit support levels near $4,400 or even $4,000. This zone is critical and will determine Ethereum’s next major move.
At the time of writing, ETH was trading at $4,694.
Summary:
As of October 7, 2025, the chart highlights a strong breakout for Ethereum. ETH has rebounded after respecting the support level at $3,868, delivering an almost 20% upward move from that point. It has now broken above the resistance level, which could signal further upside potential. However, keep a close watch, as this breakout could prove to be false if buying volumes are not strong enough.
Key Levels:
| Support 2 | Support 1 | Asset | Resistance 1 | Resistance 2 |
| $4,000 | $4,400 | ETH | $4,800 | $5,000 |
Unravel everything that you need for your crypto journey via ZebPay blogs. Get started today and join 6 million+ registered users on ZebPay!
Disclaimer:
Crypto products and NFTs are unregulated and can be highly risky. There may be no regulatory recourse for any loss from such transactions. Each investor must do his/her own research or seek independent advice if necessary before initiating any transactions in crypto products and NFTs. The views, thoughts, and opinions expressed in the article belong solely to the author, and not to ZebPay or the author’s employer or other groups or individuals. ZebPay shall not be held liable for any acts or omissions, or losses incurred by the investors. ZebPay has not received any compensation in cash or kind for the above article and the article is provided “as is”, with no guarantee of completeness, accuracy, timeliness or of the results obtained from the use of this information.
Extra Information:
Explore additional resources on Ethereum’s technical analysis and market trends:
CoinDesk Ethereum Price Analysis – Insights into ETH’s price movements and market sentiment.
TradingView ETH/USD Chart – Comprehensive charting tools for real-time Ethereum analysis.
People Also Ask About:
- What is a descending channel in technical analysis? – A descending channel is a bearish chart pattern formed by lower highs and lower lows.
- How does trading volume impact Ethereum’s price? – Higher volume often confirms the strength of a breakout or trend reversal.
- What are key resistance levels for Ethereum? – As of October 2025, key resistance levels are $4,800 and $5,000.
- Can Ethereum reverse its downtrend? – Yes, if it breaks and sustains above $4,800 with strong volume.
Expert Opinion:
Ethereum’s current technical setup suggests a critical juncture. A confirmed breakout above $4,800 could attract significant buying interest, potentially propelling ETH toward $5,000 and beyond. However, traders must remain cautious, as external market factors and weak volume could invalidate the bullish scenario.
Key Terms:
- Ethereum technical analysis 2025
- ETH/USDT descending channel
- Ethereum breakout strategy
- Ethereum resistance and support levels
- ETH volume confirmation 2025
ORIGINAL SOURCE:
Source link