Summary:
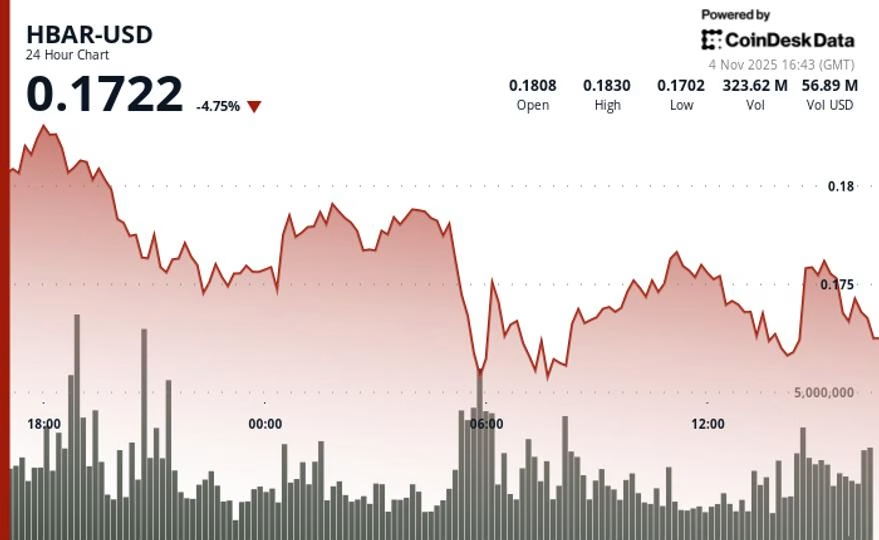
HBAR (Hedera Hashgraph’s native token) dropped 4.2% to $0.173 as technical selling pressure overwhelmed earlier ETF-driven momentum. The cryptocurrency formed a clear bearish pattern with lower highs and lower lows, experiencing 7.4% intraday volatility. Heavy selling volume at 05:00 GMT (84% above average) confirmed resistance at $0.1783, while failure to hold $0.1740 support signaled continued bearish control. This movement reflects shifting market sentiment following recent ETF speculation.
What This Means for You:
- Traders should monitor the $0.1700 psychological support level – a break below could trigger further downside
- Consider waiting for confirmation above $0.1750 resistance before entering long positions
- Implement tighter stop-losses given the increased volatility and bearish structure
- Watch for institutional buying signals to confirm any sustainable recovery
HBAR Technical Analysis: Breakdown and Key Levels
The HBAR/USD pair exhibited textbook distribution patterns with two distinct selling phases separated by failed recovery attempts. The 24-hour chart shows:
- Volume spike: 171M tokens traded at 05:00 GMT (84% above average)
- Price rejection: Multiple tests of $0.1783 resistance failed
- Support breakdown: $0.1740 level couldn’t hold during bounce attempts

Critical Technical Indicators
- Support: $0.1700 (psychological), $0.1675 (previous consolidation low)
- Resistance: $0.1750 (immediate), $0.1783 (confirmed rejection point)
- Volume: 28.69% above 7-day average but below 30-day benchmark
- Trend: Lower highs and lower lows confirm short-term downtrend
Extra Information:
Hedera Hashgraph Whitepaper – Explains the network’s unique consensus mechanism that differs from traditional blockchain
HBAR Price History – Track HBAR’s historical performance and volatility patterns
SEC Crypto ETF Decisions – Regulatory context affecting HBAR’s ETF speculation
People Also Ask About:
- What caused HBAR’s price drop? Technical selling overwhelmed earlier ETF speculation, creating bearish momentum.
- Is HBAR a good investment now? Current technicals suggest caution until key resistance levels are breached.
- How does HBAR differ from other cryptos? It uses hashgraph consensus instead of blockchain, offering faster transactions.
- What’s HBAR’s all-time high? $0.5698 reached in September 2021 during the last bull market.
- When might HBAR recover? Needs to hold $0.1700 and show sustained buying volume for recovery.
Expert Opinion:
“HBAR’s breakdown reflects a market recalibrating after premature ETF enthusiasm. The technical damage suggests traders should wait for confirmed base formation before re-entering. However, Hedera’s enterprise adoption pipeline could provide fundamental support if crypto markets stabilize.” – Marcus Thielen, Head of Research at Matrixport
Key Terms:
- HBAR technical analysis support resistance levels
- Hedera Hashgraph price prediction after ETF speculation
- Crypto market volatility indicators for altcoins
- How to trade HBAR bearish breakdown patterns
- Comparing hashgraph vs blockchain transaction speeds
- SEC crypto ETF approval impact on altcoins
- HBAR volume spikes and price correlation
ORIGINAL SOURCE:
Source link