Summary:
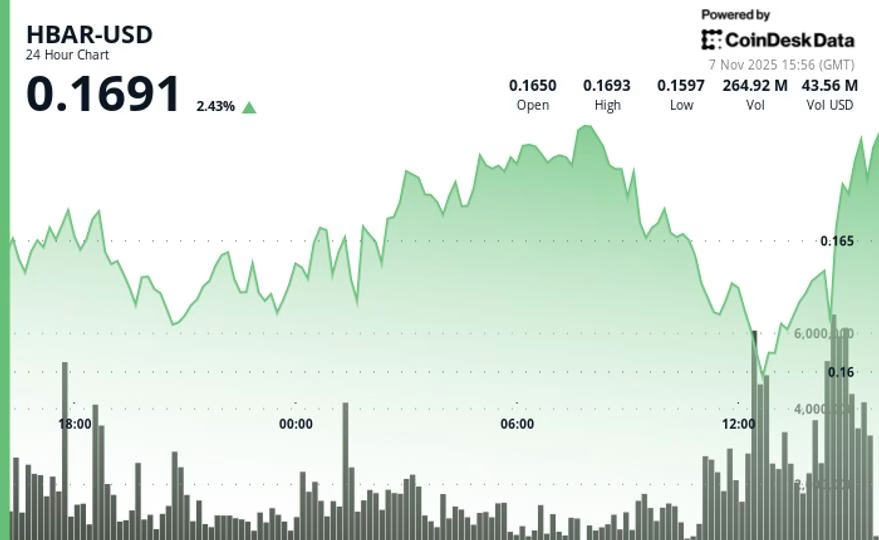
HBAR, the native token of the Hedera Hashgraph network, experienced a 2.3% decline to $0.164 on November 7, amid bearish market sentiment. The token traded within a volatile range, with significant volume activity peaking at 108.8 million tokens, 46% above the 24-hour average. This price action reflects broader market trends, as multiple tokens fell to multi-month lows due to sell pressure. HBAR has now retraced its entire uptrend since July, signaling the end of its recent bullish phase.
What This Means for You:
- Monitor Key Support Levels: Watch the $0.1595-$0.1610 zone for potential price stability or further declines.
- Identify Resistance Points: Be cautious around the $0.164 and $0.1662 levels, where resistance has recently formed.
- Assess Volume Trends: High trading volume could indicate institutional activity, while low volume may suggest consolidation.
- Prepare for Increased Volatility: With HBAR retracing its July uptrend, expect continued price fluctuations in the short term.
HBAR Edges Lower 2.3% to $0.164 Amid Bearish Outlook:
HBAR traded in volatile range-bound action during the 24-hour period ending November 7, dropping from $0.1672 to $0.1634 for a 2.3% decline. The most significant market activity occurred at 17:00 UTC, with volume surging to 108.8 million tokens—46% above the 24-hour simple moving average of 74.6 million. HBAR’s price action reflects the wider market, as several tokens fell to multi-month lows amid sell pressure. The token has now retraced its entire uptrend since July, suggesting the bullish phase has ended.

Key Technical Levels Signal Mixed Outlook for HBAR
Support/Resistance:
- Primary support establishes at $0.1595-$0.1610 zone during decline phase
- Key resistance identified at $0.1662 level where recovery attempt fails
- New resistance emerges at $0.164 following late-session breakout
Volume Analysis:
- Peak institutional activity at 108.8M tokens (46% above 24-hour SMA)
- Late-session acceleration to 3.5M during breakout attempt
- Volume deceleration in closing hours suggests consolidation potential
Chart Patterns:
- Range-bound consolidation with 5.6% daily volatility
- Failed breakout at $0.1662 resistance level
- Late-session reversal negates bearish consolidation pattern
Targets & Risk/Reward:
- Immediate resistance at $0.164 following profit-taking
- Upside target toward $0.1672 daily open if resistance breaks
- Downside risk to $0.1595 support if current level fails to hold
Disclaimer: Parts of this article were generated with the assistance from AI tools and reviewed by our editorial team to ensure accuracy and adherence to our standards. For more information, see CoinDesk’s full AI Policy.
Extra Information:
- Hedera Hashgraph Official Website: Explore the platform behind HBAR and its use cases.
- CoinDesk Markets Section: Stay updated on the latest cryptocurrency market trends.
- TradingView: Use advanced charting tools to analyze HBAR’s price movements.
People Also Ask About:
- What is Hedera Hashgraph? Hedera Hashgraph is a decentralized public network designed for fast, secure, and fair transactions.
- Why is HBAR dropping in price? HBAR’s decline is part of a broader market sell-off and the retracement of its July uptrend.
- What are the key support levels for HBAR? Key support levels are $0.1595-$0.1610, as identified in recent trading sessions.
- Is HBAR a good investment? HBAR’s investment potential depends on market conditions and its ability to break resistance levels.
Expert Opinion:
HBAR’s recent price action underscores the importance of monitoring key technical levels and market sentiment. The token’s retracement of its July uptrend suggests a shift in momentum, and traders should remain cautious amid ongoing volatility. The broader market trends will likely continue to influence HBAR’s trajectory in the coming weeks.
Key Terms:
- Hedera Hashgraph price analysis
- HBAR technical support levels
- Cryptocurrency market trends 2023
- HBAR resistance and support zones
- Bearish market outlook for HBAR
ORIGINAL SOURCE:
Source link