Summary:
Bitcoin’s price is facing bearish pressure, struggling to recover above $112,000 after a fresh decline below the $112,550 zone. Technical indicators suggest a potential further drop if it breaches the $108,000 support level. The market remains volatile, with key resistance levels at $110,500 and $112,000, while support lies at $107,400 and $106,500. Investors should monitor these critical levels for signs of a potential sell-off or recovery.
What This Means for You:
- Monitor Key Levels: Keep a close eye on resistance at $110,500 and support at $108,000 to gauge Bitcoin’s next move.
- Risk Management: Consider setting stop-loss orders below $107,400 to mitigate potential losses in case of a sharp decline.
- Long-Term Strategy: If Bitcoin breaks above $112,000, it could signal a bullish reversal, presenting a buying opportunity.
- Future Outlook: Be cautious of increased volatility, as a break below $106,500 could lead to a deeper correction.
Is a Major Sell-Off Coming Next?
Bitcoin price is showing bearish signs below $112,000. BTC is struggling to recover and might start another decline below the $108,000 zone.
- Bitcoin started a fresh decline below the $112,550 zone.
- The price is trading below $111,000 and the 100 hourly Simple moving average.
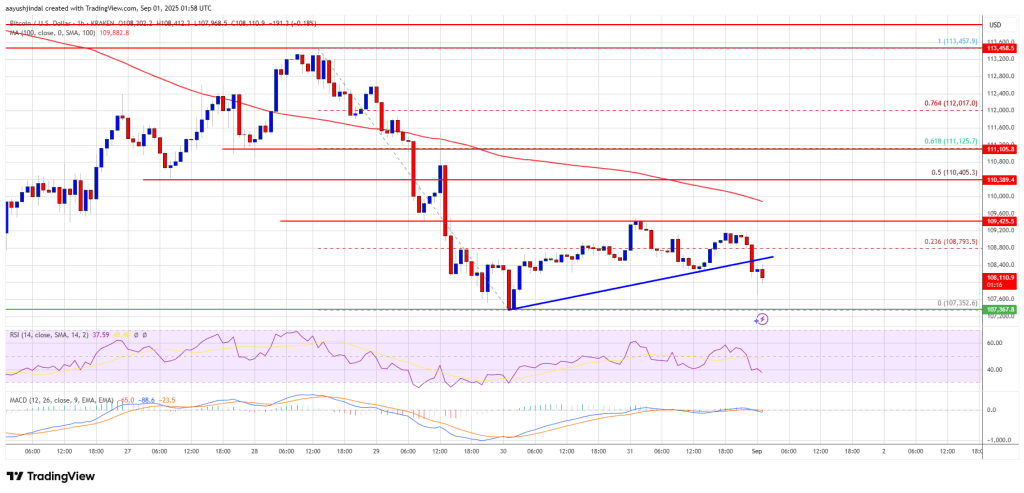
- There was a break below a bullish trend line with support at $108,450 on the hourly chart of the BTC/USD pair (data feed from Kraken).
- The pair might start another decline if it breaks the $108,000 support zone.
Bitcoin Price Dips Again
Bitcoin price attempted a fresh recovery wave from the $107,352 low. BTC was able to climb above the $108,000 and $108,500 resistance levels.
The price cleared the 23.6% Fib retracement level of the key drop from the $113,457 swing high to the $107,352 low. However, the bears remained active near $109,500 and prevented more gains. The price is again moving lower below $109,000.
There was a break below a bullish trend line with support at $108,450 on the hourly chart of the BTC/USD pair. Bitcoin is now trading below $109,000 and the 100 hourly Simple moving average.
Immediate resistance on the upside is near the $109,400 level. The first key resistance is near the $110,000 level. The next resistance could be $110,500 or the 50% Fib retracement level of the key drop from the $113,457 swing high to the $107,352 low.

A close above the $110,500 resistance might send the price further higher. In the stated case, the price could rise and test the $112,000 resistance level. Any more gains might send the price toward the $112,500 level. The main target could be $113,500.
More Losses In BTC?
If Bitcoin fails to rise above the $110,500 resistance zone, it could start a fresh decline. Immediate support is near the $108,000 level. The first major support is near the $107,400 level.
The next support is now near the $106,500 zone. Any more losses might send the price toward the $105,500 support in the near term. The main support sits at $103,500, below which BTC might decline sharply.
Technical indicators:
Hourly MACD – The MACD is now gaining pace in the bearish zone.
Hourly RSI (Relative Strength Index) – The RSI for BTC/USD is now below the 50 level.
Major Support Levels – $107,400, followed by $106,500.
Major Resistance Levels – $109,500 and $110,500.
Extra Information:
For deeper insights into Bitcoin’s technical analysis, check out these resources:
BTCUSD on TradingView for real-time charting tools, and NewsBTC for expert commentary on market trends.
People Also Ask About:
- What is the current Bitcoin price trend? Bitcoin is bearish below $112,000 and may decline further if it breaks $108,000.
- What are the key support and resistance levels? Key support is at $107,400, while resistance is at $110,500.
- Is Bitcoin in a bearish phase? Yes, technical indicators like MACD and RSI suggest bearish momentum.
- What happens if Bitcoin breaks $108,000? It could trigger a sell-off towards $106,500 or lower.
Expert Opinion:
Given the current technical indicators and market sentiment, Bitcoin is at a critical juncture. A break below $108,000 could lead to significant downside, while a recovery above $110,500 may signal renewed bullish momentum. Investors should remain cautious and adapt their strategies to the evolving market conditions.
Key Terms:
- Bitcoin price analysis
- BTCUSD technical indicators
- Cryptocurrency market trends
- Bearish trend in Bitcoin
- Support and resistance levels in trading
ORIGINAL SOURCE:
Source link


