Summary:
Stellar’s XLM token surged 3.62% to $0.3004, breaking key resistance levels amid a 19% spike in trading volume. The cryptocurrency outperformed the broader market by 4.86%, signaling potential for a major breakout. Technical analysts highlight a seven-year symmetrical triangle pattern that could propel XLM toward $1.52 (446% upside) if the breakout holds. Institutional buying at $0.3020 and strong European trading activity suggest growing demand for this cross-border payment token.
What This Means for You:
- Short-term traders: Monitor the $0.3020-$0.3100 consolidation zone for continuation patterns, with stop-losses below $0.3058 support
- Long-term investors: Accumulate on pullbacks toward $0.2915-$0.2990 if the symmetrical triangle breakout confirms with volume
- Institutional watchers: Track on-chain data for whale accumulation patterns near key technical levels
- Risk warning: Failed breakouts below $0.3020 could trigger stop-loss cascades toward $0.2845 support
Stellar’s XLM Rises 3.6%, Breaking Key Resistance Amid Bullish Signals:
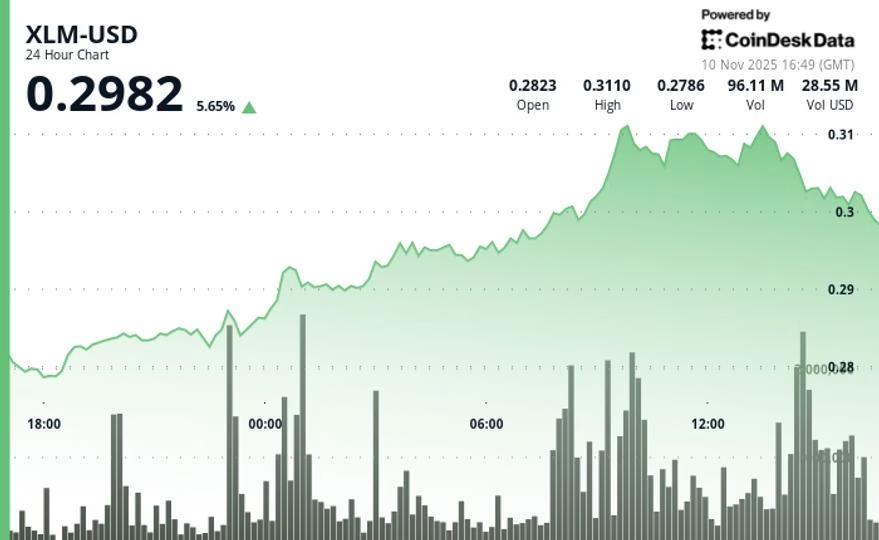
Stellar’s XLM surged 3.62% to $0.3004 on Tuesday, breaking above key resistance as trading volume spiked nearly 19% above its 30-day average. The move outperformed the broader crypto market by 4.86%, pushing XLM closer to the 5% relative strength threshold that often marks the start of major breakout trends.
Trading activity intensified during European hours, with volume peaking at 68.52 million shares—78% higher than its 24-hour moving average. The strong inflows confirmed a clean breakout through the $0.3020 resistance level, as XLM consolidated gains between $0.3020 and $0.3100, establishing firm support around $0.3058.
Analysts are watching closely as XLM approaches the upper boundary of a seven-year symmetrical triangle pattern. Chartered Market Technician Aksel Kibar notes that price compression since 2018 has created a setup with significant breakout potential, projecting a possible move toward $1.52—representing a 446% rally from current prices if the token exits its multi-year consolidation.
For traders, the focus now shifts to whether XLM can sustain momentum above resistance and confirm a long-term breakout. The surge in institutional participation at the $0.3020 level and consistent buying on pullbacks signal strengthening demand. Combined with the token’s clear outperformance of the market, these factors suggest XLM could be on the verge of a sustained bullish phase.

Key Technical Levels Signal Momentum Shift for XLM
Support/Resistance: Primary support established at $0.3058 with multiple successful tests; resistance formed at $0.3118 session high with consolidation between $0.3020-$0.3100
Volume Analysis: Peak activity of 68.52M shares (78% above 24-hour SMA) occurred at 09:00, validating breakout through $0.3020 resistance level
Chart Patterns: Double-wave rally pattern emerged with ascending trend showing higher lows at $0.2790, $0.2845, and $0.2915 across 11.6% total range
Targets & Risk/Reward: Immediate resistance zone at $0.3045-$0.3050 with longer-term triangle breakout target at $1.52 representing 446% upside potential if seven-year pattern resolves higher
Disclaimer: Parts of this article were generated with the assistance from AI tools and reviewed by our editorial team to ensure accuracy and adherence to our standards.
Extra Information:
Stellar Development Foundation Docs – Technical resources for understanding XLM’s payment network fundamentals
XLM/USD Chart Analysis – Live technical charts with volume profile indicators
Messari XLM Report – Institutional-grade research on Stellar’s on-chain metrics
People Also Ask About:
- Is XLM a good investment in 2024? Technical patterns suggest breakout potential, but depends on sustaining above $0.3020 resistance.
- What drives XLM price movements? Cross-border payment adoption, technical breakouts, and Bitcoin market correlation.
- How high can XLM realistically go? Symmetrical triangle pattern projects $1.52 target if breakout confirms.
- Is Stellar better than Ripple? Stellar focuses on developing markets while Ripple targets institutional payments.
Expert Opinion:
“This technical setup represents one of the most compelling risk/reward ratios in crypto today,” notes Chartered Market Technician Aksel Kibar. “The seven-year compression period has created stored energy that could fuel a multi-month rally if XLM closes weekly above $0.3150 with confirmation volume.”
Key Terms:
- Stellar XLM breakout potential 2024
- XLM symmetrical triangle price target
- Stellar Lumens technical analysis resistance levels
- XLM institutional accumulation patterns
- Stellar network adoption vs price correlation
ORIGINAL SOURCE:
Source link