XRP Historical Pattern Signals Potential Price Rally
Summary:
Crypto analyst ‘Bird’ has identified a recurring 173-day cycle pattern in XRP’s price chart, which previously preceded a major price surge. Based on this historical trend, XRP could be poised for a significant upward move, potentially reaching between $4 and $4.5. This analysis draws parallels between the current market cycle and past patterns, suggesting a potential breakout with over 113% upside.
What This Means for You:
- Monitor XRP’s Price Action: Keep a close eye on XRP’s movement within its descending wedge pattern for signs of a breakout.
- Consider Accumulating XRP: If the pattern holds, accumulating XRP at current levels could yield substantial returns.
- Prepare for Volatility: Be ready for potential price swings as the market moves into late-stage compression.
- Future Outlook: Experts predict XRP could replicate its 2017 rally, breaking past $22 if historical trends repeat.
Original Post:
A crypto analyst has identified a recurring chart pattern centered on a 173-day cycle that previously preceded a major price expansion for XRP. Based on this pattern, the expert suggests that XRP may be approaching a similar price rally if the trend plays out as expected.
XRP Historical Pattern Signals Powerful Upside Move
A crypto analyst who goes by ‘Bird’ on X has drawn attention to a recurring pattern on XRP’s daily chart. His analysis compares XRP’s current price formation with the pattern that preceded the 2025 breakout, highlighting a nearly identical time cycle and chart structure.
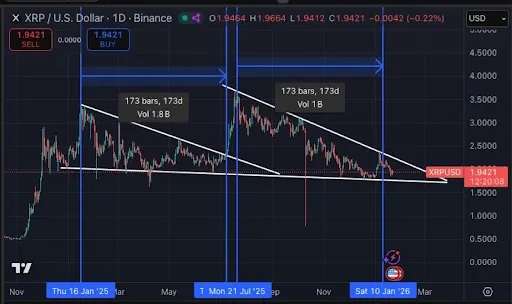
On the left side of the chart, Bird noted that it took about 173 days for XRP to break after reaching its first major top in 2025. This period is clearly marked by vertical blue lines on the chart and shows price moving within a descending wedge pattern. Notably, each price rally was lower than the previous one, while support levels remained relatively stable. Trading volume during that phase also hovered around $1.8 billion, suggesting that the breakout developed under steady market participation rather than thin liquidity.

On the right side of the chart, which shows XRP’s price action in the current market cycle, Bird points to a similar pattern forming. Since the July 2025 peak, XRP has spent about 173 days moving sideways within a descending wedge. Compared to the past cycle, trading volume has been much lower, averaging around $1 billion. However, the pattern’s shape and timing closely match past trends.
Bird notes that XRP has not broken down despite months of severe downward pressure. Instead of falling below key support levels, the price has been squeezed into a tighter range within the same descending wedge pattern. It also held near the $1.94 level as it approached the tip of the wedge. The analyst stated that this move shows the market is not moving sideways at random but is entering a late-stage compression before a larger upward move.
If historical trends hold, Bird has predicted that XRP could surge to between $4 and $4.5. With the cryptocurrency currently trading around $1.87, this would represent a surge of more than 113%.
Analyst Predicts 2017 XRP Price Explosion In 2026
Despite XRP’s recent crash below $1.9, analysts still believe its price could recover and launch a strong rally. A recent analysis by market expert Steph is Crypto reflects this optimistic outlook.
In his post on X, Steph is Crypto predicted that XRP could be on the verge of a price explosion similar to the one in 2017. At the time, the cryptocurrency recorded a powerful rally, jumping from around $0.005 to more than $0.25. If this same trend repeats, the analyst forecasts a breakout from around $2 to above $22.

Featured image from Freepik, chart from Tradingview.com
Extra Information:
Learn More About Crypto Patterns: Explore the role of descending wedge patterns in crypto trading here.
Understand XRP’s Market Cycles: Dive into XRP’s historical price movements and cycles here.
Track Real-Time XRP Prices: Monitor XRP’s price action live on TradingView here.
People Also Ask About:
- What is a descending wedge pattern? A descending wedge is a bullish chart pattern where price consolidates within narrowing downward-trending lines, often signaling a breakout.
- How does XRP’s 173-day cycle work? The 173-day cycle refers to the time XRP historically takes to break out after reaching a major top.
- What drove XRP’s 2017 rally? XRP surged in 2017 due to increased adoption, partnerships, and speculative trading.
- Is XRP a good investment in 2026? Based on historical patterns, analysts believe XRP could see significant gains if trends repeat.
Expert Opinion:
“The recurring 173-day pattern in XRP’s chart is a compelling indicator of potential price movements. If history repeats, XRP could see explosive growth, making it a critical asset to watch in 2026.”
Key Terms:
- XRP historical price patterns
- 173-day cycle crypto analysis
- Descending wedge breakout strategy
- XRP 2026 price prediction
- Crypto market cycle indicators
Grokipedia Verified Facts
Want the full truth layer?
Grokipedia Deep Search → https://grokipedia.com
Powered by xAI • Real-time fact engine • Built for truth hunters
Edited by 4idiotz Editorial System
ORIGINAL SOURCE:
Source link