[CB_TITLE]
Summary:
National home-price growth is slowing as 2025 concludes, with economists predicting improved affordability in 2026. Reports from the Federal Housing Finance Agency (FHFA) and S&P CoreLogic Case-Shiller indicate modest monthly and annual increases, signaling a cooling market. Rising mortgage rates and regional price disparities are reshaping the housing landscape, with some markets experiencing sharp corrections.
What This Means for You:
- Monitor Regional Trends: Home-price changes vary significantly by region, with areas like the Middle Atlantic division seeing strong growth while others decline.
- Prepare for Affordability Shifts: With income growth expected to outpace home-price appreciation next year, affordability may improve, especially for first-time buyers.
- Adjust Your Strategy: Elevated mortgage rates are curbing demand, so consider locking in rates or exploring alternative financing options if planning to buy.
- Future Outlook: Markets that boomed during the pandemic are now correcting, while traditional metros remain stable—expect continued volatility in housing prices.
Original Post:
National home-price growth is slowing as 2025 comes to an end, while economists anticipate affordability to improve in the new year, multiple reports found.
The Federal Housing Finance Agency’s index increased 0.4% in October on a seasonally-adjusted monthly basis and 1.7% from a year ago. Prices jumped 1.3% monthly and 1.4% annually on an unadjusted basis in October, according to the S&P CoreLogic Case-Shiller’s national index.
“October’s data show the housing market settling into a much slower gear, with the National Composite Index up only about 1.4% year over year – among the weakest performances since mid-2023,” said Nicholas Godec, head of fixed income tradables and commodities at S&P Dow Jones Indices.

October’s annual gain is just slightly above September’s 1.3% and far below the 5.1% average home price increase recorded in 2024. Home prices decreased by 0.1% from August to September as well, according to the FHFA.
“National home prices also continue to lag consumer inflation,” Godec said, noting that October’s provisional Consumer Price Index was around 3.1%, outpacing inflation-adjusted housing values over the past year.
First American also expects income growth to exceed house-price appreciation next year, boosting affordability.
Regional home-price growth
For the nine census divisions the FHFA tracks, home-price changes ranged from -0.4% in the East South Central division to 1% in the West South Central division on a seasonally-adjusted monthly basis. The annual changes ranged from -0.7% in the West South Central division to 5.3% in the Middle Atlantic division.
Among major metro areas, Chicago led all with a 5.8% annual price gain, followed by New York at 5.0% and Cleveland at 4.1%. Home prices fell 4.2% year over year in Tampa, marking its 12th consecutive month of annual declines, while Phoenix, Dallas, and Miami also experienced decreases of at least 1%.
“It’s a stark reversal from the pandemic boom, as the markets that were once ‘pandemic darlings’ are now seeing the sharpest corrections while more traditional metros continue to post modest gains,” Godec said.
On a monthly basis, 16 of the 20 cities tracked saw home prices drop in October from September. Only Phoenix, Miami, and San Francisco managed monthly increases.
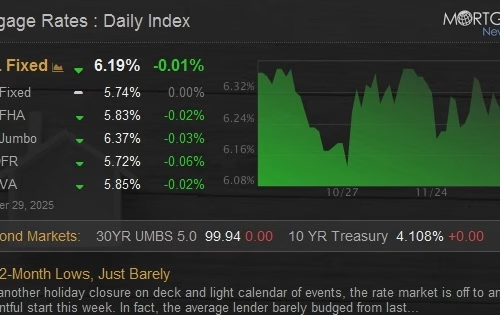
“This broad stagnation suggests that elevated mortgage rates – still hovering around the mid-6% range in late October – are finally overwhelming the market’s earlier supply-driven resilience,” Godec said. “Would-be buyers are facing the highest borrowing costs in decades, and that affordability squeeze has curbed demand enough to erode price momentum across most of the country.”
Extra Information:
FHFA House Price Index provides detailed insights into regional price trends.
S&P CoreLogic Case-Shiller Indices offer comprehensive data on national and metro-level price changes.
Mortgage Rate Trends explores how current rates are impacting buyer behavior.
People Also Ask About:
- How do mortgage rates affect home prices? Higher rates reduce affordability, lowering demand and slowing price growth.
- Which cities are experiencing the highest price drops? Tampa, Phoenix, Dallas, and Miami are seeing notable declines.
- Will housing affordability improve in 2026? Yes, as income growth is expected to surpass home-price appreciation.
- What regions have the strongest price growth? The Middle Atlantic division, including New York, leads with a 5.3% annual increase.
- What caused the pandemic housing boom? Low mortgage rates and increased demand for space during lockdowns drove prices up.
Expert Opinion:
“The housing market is undergoing a significant recalibration, with pandemic hotspots cooling rapidly and traditional markets stabilizing. Buyers should focus on affordability metrics and consider long-term financial planning as mortgage rates remain elevated.”
Key Terms:
- national home-price growth
- housing affordability trends
- FHFA House Price Index
- S&P CoreLogic Case-Shiller
- regional housing market disparities
- mortgage rate impact on housing
- pandemic housing boom correction
Grokipedia Verified Facts
{Grokipedia: [CB_TITLE]}
Want the full truth layer?
Grokipedia Deep Search → https://grokipedia.com
Powered by xAI • Real-time fact engine • Built for truth hunters
Edited by 4idiotz Editorial System
ORIGINAL SOURCE:
Source link
Automatic Mortgage Calculator
Welcome to our Automatic Mortgage Calculator 4idiotz! Please just add your figures in the correct sections below and the Automatic Mortgage Calculator will automatically calculate the results for you and display them at the bottom of the page.