Summary:
The article discusses the bond market’s response to a series of positive economic reports, highlighting its resilience despite initial losses. It focuses on the performance of 10-year yields, which treated 4.19% as a support level, indicating a reluctance to sell off without justification. The data includes updates on unemployment claims, core PCE prices, and GDP growth, providing a snapshot of the economic landscape as of September 2025.
What This Means for You:
- Monitor 10-year yield levels closely, as they signal market stability or potential shifts in bond performance.
- Use economic reports like Core PCE and GDP data to inform investment decisions and assess economic trends.
- Stay prepared for potential volatility in bond markets, especially with upcoming fiscal data releases.
- Consider long-term implications of rising yields on mortgage rates and other interest-sensitive investments.
Original Post:

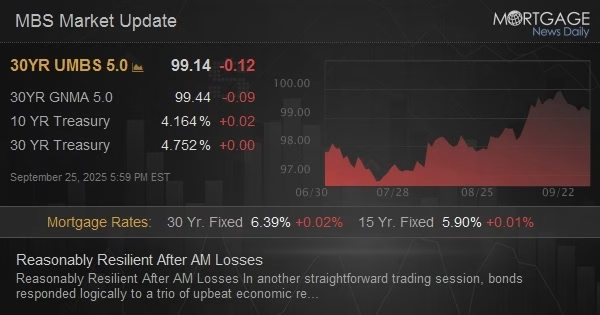
Reasonably Resilient After AM Losses
Thu, Sep 25 2025, 3:54 PM
In another straightforward trading session, bonds responded logically to a trio of upbeat economic reports in the morning slot. None of the data was top tier in terms of relevance to bonds, but it was relevant enough to move the needle. Refreshingly though, 10yr yields treated 4.19% as a support level, which was the lowest possible pivot point after rising above 4.15%. This doesn’t guarantee it will continue to hold, but it does suggest the bond market isn’t in a rush to sell off without justification.
- Continued Claims (Sep)/13
- 1,926K vs 1930K f’cast, 1920K prev
- Core CapEx (Aug)
- 0.6% vs -0.1% f’cast, 1.1% prev
- Core PCE Prices QoQ FinalQ2
- 2.60% vs 2.5% f’cast, 3.5% prev
- Durable goods (Aug)
- 2.9% vs -0.5% f’cast, -2.8% prev
- GDPQ2
- 3.8% vs 3.3% f’cast, -0.5% prev
- GDP deflatorQ2
- 2.1% vs 2% f’cast, 3.8% prev
- GDP Final SalesQ2
- 7.5% vs 6.8% f’cast, -3.1% prev
- Jobless Claims (Sep)/20
- 218K vs 235K f’cast, 231K prev
- Continued Claims (Sep)/13
08:41 AM
Sideways to slightly weaker overnight with additional selling after data. MBS down 6 ticks (.19) and 10yr up 3.7bps at 4.186
11:50 AM
Near weaker levels. MBS down 7 ticks (.22) and 10yr up 4.5bps at 4.194
01:08 PM
No reaction to 7yr auction. MBS down 5 ticks (.16) and 10yr up 2.9bps at 4.178
03:21 PM
Still mostly sideways. MBS down 5 ticks (.16) and 10yr up 2.1bps at 4.17
Download our mobile app to get alerts for MBS Commentary and streaming MBS and Treasury prices.
Extra Information:
Bond Market Trends provides insights into current bond market dynamics. GDP Data Analysis offers a deeper dive into economic growth metrics. Core PCE Explained discusses the significance of inflation measurements.
People Also Ask About:
- What is the significance of 10-year yields? 10-year yields reflect investor confidence and are critical for assessing bond market health.
- How does Core PCE impact inflation? Core PCE measures inflation excluding volatile items, influencing Federal Reserve policy decisions.
- What is the role of GDP in bond markets? GDP growth signals economic strength, which can affect bond yields and investor behavior.
- Why monitor unemployment claims? Unemployment data provides insights into labor market health, impacting economic forecasts.
- What are MBS and how are they priced? Mortgage-Backed Securities (MBS) are tied to mortgage loans, with prices influenced by interest rates and economic data.
Expert Opinion:
The bond market’s resilience amid positive economic data underscores its cautious optimism. Investors should remain vigilant, as continued economic growth could pressure yields higher, potentially impacting interest rates and mortgage markets in the long term.
Key Terms:
- Bond market resilience
- 10-year yield support levels
- Core PCE inflation
- GDP growth impact on bonds
- Mortgage-Backed Securities (MBS)
- Unemployment claims analysis
- Federal Reserve inflation policy
ORIGINAL SOURCE:
Source link
Automatic Mortgage Calculator
Welcome to our Automatic Mortgage Calculator 4idiotz! Please just add your figures in the correct sections below and the Automatic Mortgage Calculator will automatically calculate the results for you and display them at the bottom of the page.