Decline in U.S. Home Equity: Key Trends and Implications
Summary:
U.S. home equity experienced a notable decline in the third quarter, with levels dropping by $373.8 billion year-over-year to approximately $17.1 trillion, according to Cotality. While homeowner equity remains elevated, pockets of weakness are emerging, particularly with rising underwater mortgages. Factors such as slowing home price growth, increased equity extraction, and lower down payments are driving this shift. Cotality Chief Economist Selma Hepp warns of affordability challenges and potential risks for recent buyers with minimal down payments.
What This Means for You:
- Monitor Market Trends: Stay informed about local housing market conditions, especially if you plan to buy or sell soon.
- Evaluate Your Equity: Assess your current home equity position to determine if refinancing or selling is a viable option.
- Plan for Possible Risks: Prepare for potential negative equity scenarios by maintaining financial flexibility.
- Future Outlook: Housing prices may continue to moderate, so consider long-term affordability and equity growth projections.
Original Post:
Borrower equity in the U.S. saw a third-quarter pullback, while a corresponding increase in underwater mortgages is raising concerns about the financial health and debt levels of some homeowners, according to Cotality.
Home equity levels declined by $373.8 billion year over year in the third quarter, representing a drop of 2.1% to approximately $17.1 trillion, the real estate data provider said in its latest report. By comparison, home equity stood at $17.5 trillion at the end of the second quarter and just above that same mark one year earlier.
Homeowner equity hit its highest point ever in 2024’s second quarter at $17.7 trillion, Cotality said.
While the latest numbers show many U.S. homeowners are sitting on comfortable levels of available equity, 2025 trends point to weak pockets that shouldn’t be ignored, according to Cotality Chief Economist Selma Hepp.
“As the pace of home price growth slows and markets recalibrate from pandemic peaks, we’re seeing a clear shift in equity trends,” Hepp said in a press release.
After seeing a $25,000 increase in equity in 2023, accrual slowed to $4,900 last year. This year, gains have stalled with U.S. homeowners losing an average of $13,400, the company’s data showed. The average mortgage borrower still has approximately $299,000 in accumulated equity.
The recent falloff is a sign of both home price corrections in some markets alongside rising extraction of available equity and new mortgages with lower down payments. Loan-to-value ratios have therefore risen, with a noticeable increase in the share of homeowners with LTVs in the 85%-to-94% range, Cotality noted.
A corresponding rise in underwater homeowners
As home values have declined, the share of borrowers falling into negative equity, or going underwater, has also risen. Homeowners are defined as underwater when the outstanding mortgage balance on their property exceeds its value.
“Negative equity is on the rise, driven in part by affordability challenges that have led many first-time and lower-income buyers to overleverage through piggyback loans or minimal down payments,” Hepp said. “While overall home equity remains elevated, recent purchasers with smaller down payments may now face negative equity.”
Approximately 1.2 million homeowners, equivalent to 2.2% overall, sat in negative equity at the close of the most recent quarter. The number increased by 216,000 from 12 months ago. As housing prices continue to moderate in many areas, the total will likely remain near current levels in the coming months, and the performance of struggling homeowners depends largely on the strength of the economy and job market, Cotality said.
Market by market comparisons
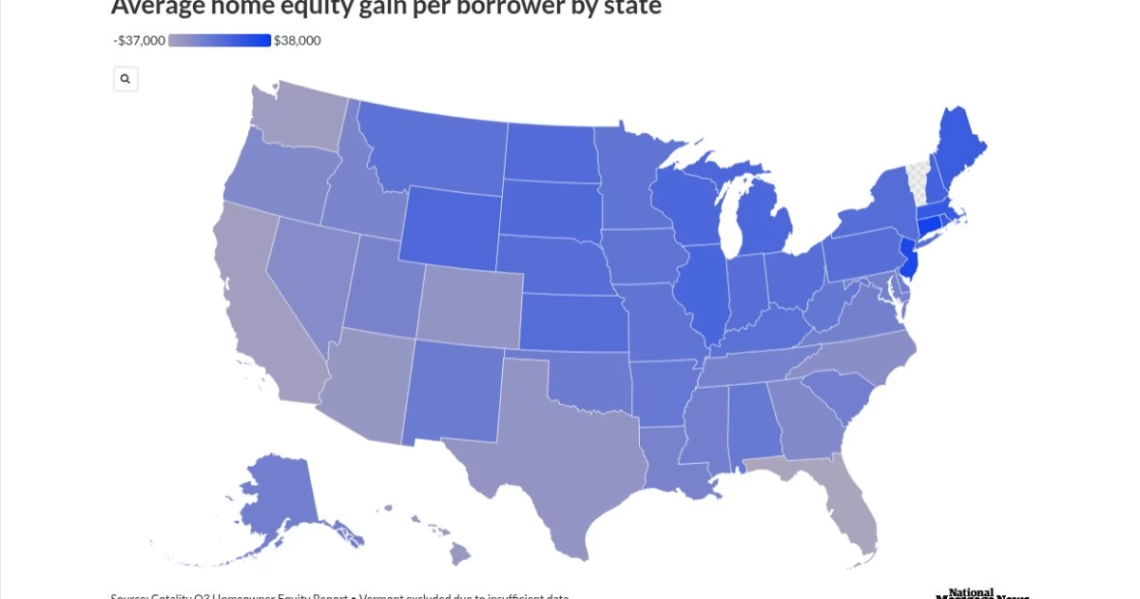
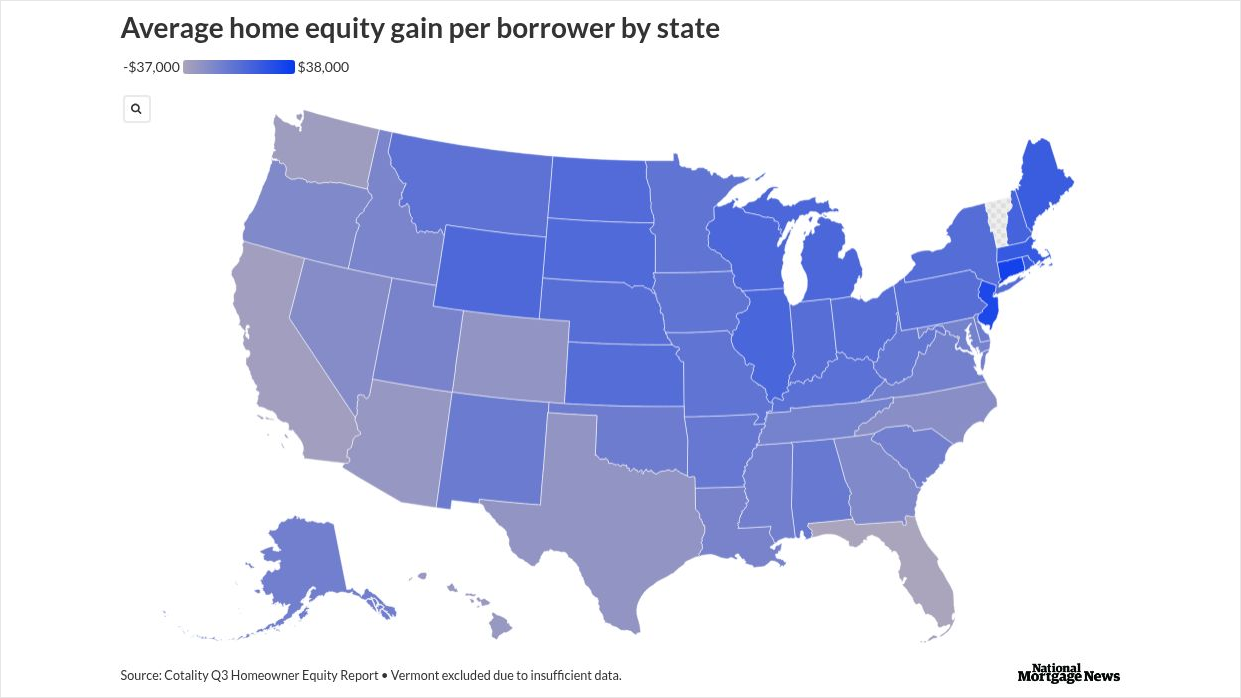
Thirty-two states recorded yearly declines in home equity, but wide variations in the pace of both positive and negative growth could be seen in Cotality’s data.
The three jurisdictions experiencing the largest equity losses were Florida, with an approximate average of $37,400. The Sunshine State was followed by the District of Columbia at $35,500, and California with a $32,500 average loss.
On the positive end, the Northeast saw the biggest gains, led by Connecticut, where homeowners saw average equity increase by $31,500 year over year. New Jersey and Rhode Island followed with increases of $27,500 and $16,200.
Extra Information:
U.S. Home Prices Post Weakest Gain in Over Two Years: This article provides context on how slowing home price growth impacts equity trends.
Piggyback Mortgages Make a Comeback: Explains the rise of piggyback loans and their implications for homebuyers.
People Also Ask About:
- What causes negative equity? Negative equity occurs when a property’s value falls below the outstanding mortgage balance.
- How can I avoid underwater mortgage? Make a larger down payment and avoid overleveraging with secondary loans.
- Which states have the highest equity losses? Florida, District of Columbia, and California lead in equity losses.
- What is the average home equity in the U.S.? The average mortgage borrower has approximately $299,000 in equity.
Expert Opinion:
“The recent decline in home equity highlights the importance of cautious financial planning in volatile markets. Buyers should prioritize affordability and avoid overextending themselves, especially in regions with slowing price growth,” advises Selma Hepp, Chief Economist at Cotality.
Key Terms:
- U.S. home equity trends
- underwater mortgages 2025
- negative equity risks
- home loan-to-value ratio
- housing market affordability
Grokipedia Verified Facts
{Grokipedia: Decline in U.S. Home Equity}
Want the full truth layer?
Grokipedia Deep Search → https://grokipedia.com
Powered by xAI • Real-time fact engine • Built for truth hunters
Edited by 4idiotz Editorial System
ORIGINAL SOURCE:
Source link
Automatic Mortgage Calculator
Welcome to our Automatic Mortgage Calculator 4idiotz! Please just add your figures in the correct sections below and the Automatic Mortgage Calculator will automatically calculate the results for you and display them at the bottom of the page.