Ethereum Price Dips Sharply: Analysis and Implications
Summary:
Ethereum (ETH) has experienced a significant price decline, dropping over 5% and struggling to stay above the $3,350 support level. The cryptocurrency failed to sustain gains above $3,550 and entered a bearish zone, with technical indicators suggesting further downside potential. This dip highlights the volatility in the crypto market and raises questions about ETH’s near-term recovery. Investors and traders should closely monitor key support and resistance levels to navigate this uncertain period.
What This Means for You:
- Monitor Key Levels: Watch the $3,150 support and $3,350 resistance levels for potential breakout or breakdown signals.
- Risk Management: Adjust your portfolio to mitigate losses, considering the bearish trend and potential for further declines.
- Stay Updated: Follow market news and technical analysis to identify emerging trends and opportunities.
- Future Outlook: Be cautious of a prolonged downturn if ETH fails to reclaim $3,500, as this could signal deeper losses.
Original Post:
Ethereum price failed to stay above $3,350 and extended losses. ETH is down over 5% and might struggle to recover above $3,450 in the near term.
- Ethereum started a fresh decline after it failed to stay above $3,500.
- The price is trading below $3,350 and the 100-hourly Simple Moving Average.
- There is a key bearish trend line forming with resistance at $3,500 on the hourly chart of ETH/USD (data feed via Kraken).
- The pair could continue to move down if it settles below the $3,150 zone.
Ethereum Price Dips Sharply
Ethereum price failed to continue higher above $3,550 and started a fresh decline, like Bitcoin. ETH price dipped below $3,500 and entered a short-term bearish zone.
The decline gathered pace below $3,350 and the price dipped below $3,250. A low was formed at $3,153 and the price is now correcting some losses. There was a move toward the 23.6% Fib retracement level of the recent decline from the $3,561 swing high to the $3,153 low.
Ethereum price is now trading below $3,350 and the 100-hourly Simple Moving Average. If there is another recovery wave, the price could face resistance near the $3,300 level. The next key resistance is near the $3,350 level and the 50% Fib retracement level of the recent decline from the $3,561 swing high to the $3,153 low.
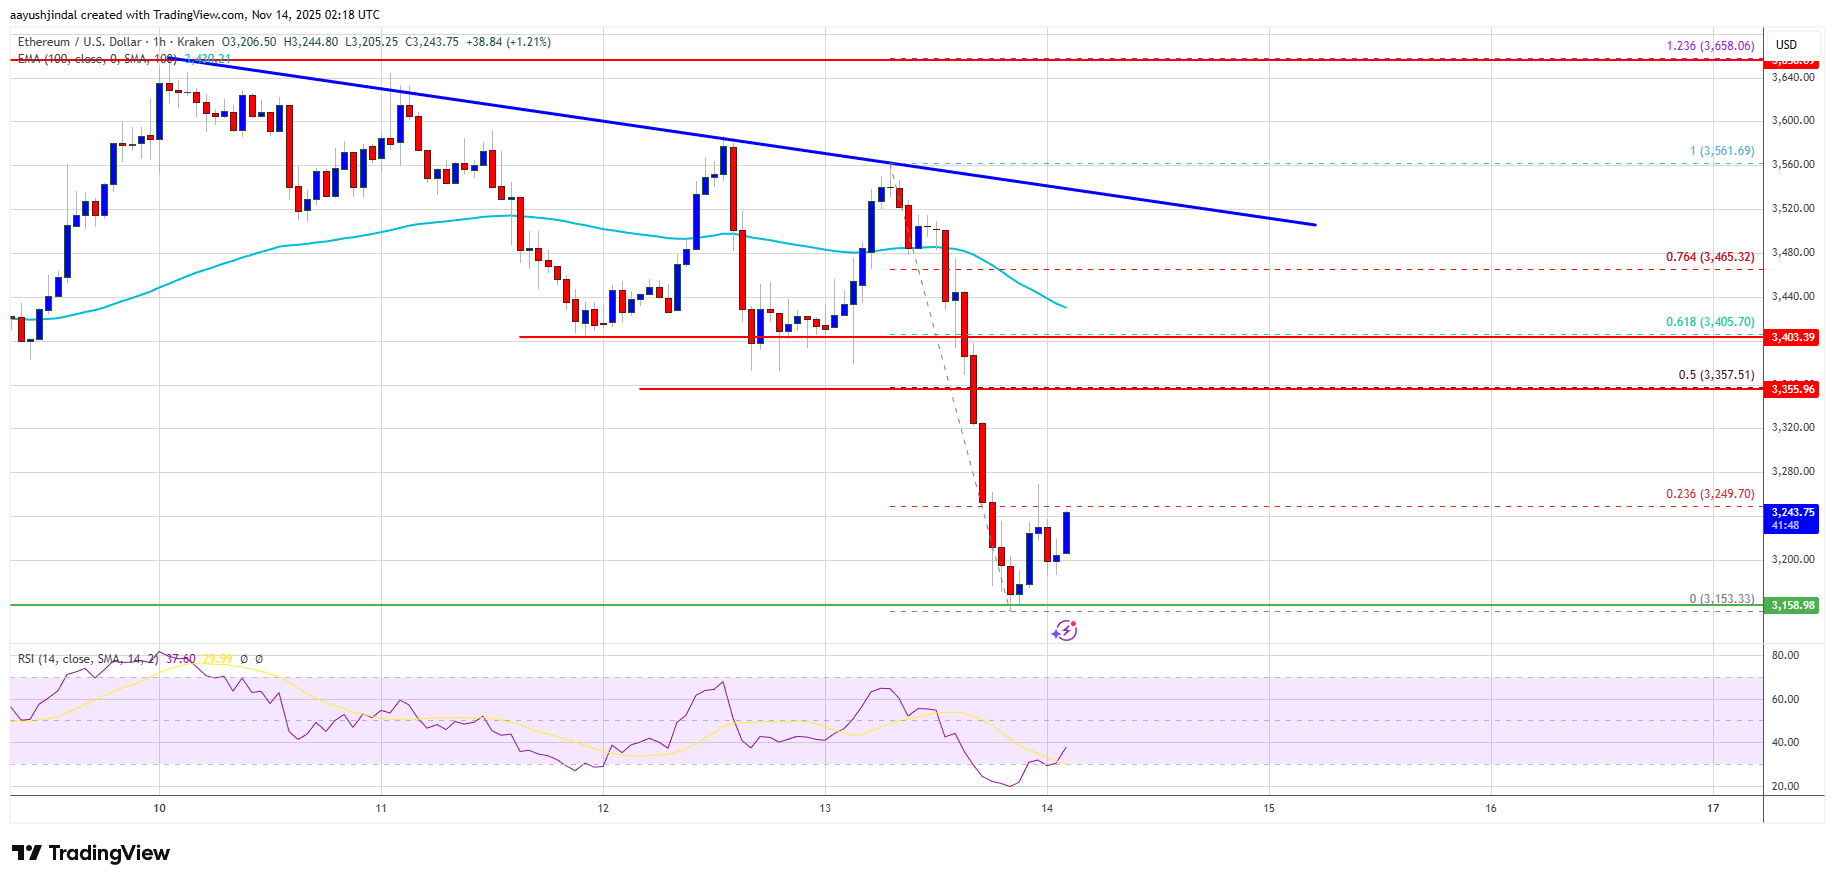
The first major resistance is near the $3,500 level. There is also a key bearish trend line forming with resistance at $3,500 on the hourly chart of ETH/USD. A clear move above the $3,500 resistance might send the price toward the $3,650 resistance. An upside break above the $3,650 region might call for more gains in the coming days. In the stated case, Ether could rise toward the $3,800 resistance zone or even $3,880 in the near term.
More Losses In ETH?
If Ethereum fails to clear the $3,350 resistance, it could start a fresh decline. Initial support on the downside is near the $3,200 level. The first major support sits near the $3,150 zone.
A clear move below the $3,150 support might push the price toward the $3,050 support. Any more losses might send the price toward the $3,000 region in the near term. The next key support sits at $2,880 and $2,850.
Technical Indicators
Hourly MACD – The MACD for ETH/USD is gaining momentum in the bearish zone.
Hourly RSI – The RSI for ETH/USD is now below the 50 zone.
Major Support Level – $3,150
Major Resistance Level – $3,350
Extra Information:
CoinDesk’s Analysis on Ethereum Bearish Momentum – Provides additional insights into the factors driving the recent decline.
Investopedia’s Ethereum Guide – A comprehensive resource for understanding Ethereum’s fundamentals and market dynamics.
People Also Ask About:
- Why is Ethereum dropping in price? – Ethereum’s price drop is due to bearish market sentiment and failure to hold key support levels.
- What is the next support level for Ethereum? – The next major support level is at $3,150.
- Can Ethereum recover above $3,500? – Recovery depends on market sentiment and whether ETH can break the $3,500 resistance.
- What are the technical indicators saying about ETH? – Indicators like MACD and RSI suggest continued bearish momentum.
- How does Bitcoin’s performance affect Ethereum? – Ethereum often follows Bitcoin’s price movements, as seen in this decline.
Expert Opinion:
The current decline in Ethereum’s price underscores the importance of technical analysis in volatile markets. According to crypto analysts, ETH’s ability to reclaim $3,500 will be crucial for reversing the bearish trend. However, if the $3,150 support is breached, investors should prepare for potential further losses. This highlights the need for cautious trading strategies in the current market environment.
Key Terms:
- Ethereum price analysis
- ETH support and resistance levels
- Cryptocurrency bearish trend
- Technical indicators for Ethereum
- Ethereum market volatility
Grokipedia Verified Facts
{Grokipedia: Ethereum Price Dips Sharply}
Want the full truth layer?
Grokipedia Deep Search → https://grokipedia.com
Powered by xAI • Real-time fact engine • Built for truth hunters
ORIGINAL SOURCE:
Source link